Immigrants from North America vs Sioux In Labor Force | Age > 16
COMPARE
Immigrants from North America
Sioux
In Labor Force | Age > 16
In Labor Force | Age > 16 Comparison
Immigrants from North America
Sioux
63.7%
IN LABOR FORCE | AGE > 16
0.0/ 100
METRIC RATING
296th/ 347
METRIC RANK
61.8%
IN LABOR FORCE | AGE > 16
0.0/ 100
METRIC RATING
326th/ 347
METRIC RANK
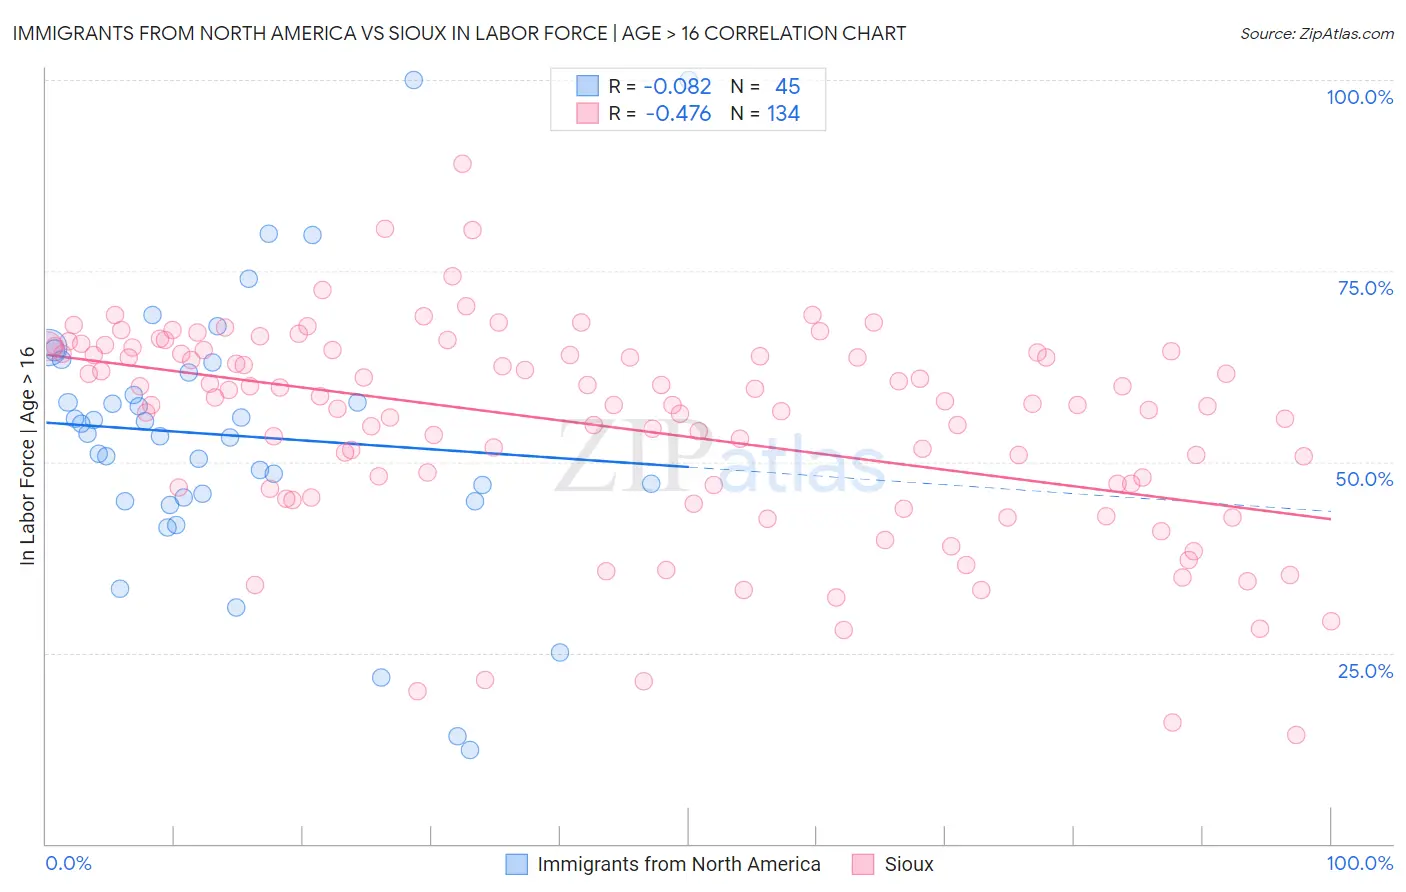
Immigrants from North America vs Sioux In Labor Force | Age > 16 Correlation Chart
The statistical analysis conducted on geographies consisting of 462,474,415 people shows a slight negative correlation between the proportion of Immigrants from North America and labor force participation rate among population ages 16 and over in the United States with a correlation coefficient (R) of -0.082 and weighted average of 63.7%. Similarly, the statistical analysis conducted on geographies consisting of 234,180,906 people shows a moderate negative correlation between the proportion of Sioux and labor force participation rate among population ages 16 and over in the United States with a correlation coefficient (R) of -0.476 and weighted average of 61.8%, a difference of 3.0%.
In Labor Force | Age > 16 Correlation Summary
| Measurement | Immigrants from North America | Sioux |
| Minimum | 12.2% | 14.3% |
| Maximum | 100.0% | 89.1% |
| Range | 87.8% | 74.8% |
| Mean | 53.4% | 54.7% |
| Median | 53.7% | 57.6% |
| Interquartile 25% (IQ1) | 45.2% | 46.6% |
| Interquartile 75% (IQ3) | 62.4% | 64.3% |
| Interquartile Range (IQR) | 17.2% | 17.7% |
| Standard Deviation (Sample) | 17.8% | 13.6% |
| Standard Deviation (Population) | 17.6% | 13.6% |
Similar Demographics by In Labor Force | Age > 16
Demographics Similar to Immigrants from North America by In Labor Force | Age > 16
In terms of in labor force | age > 16, the demographic groups most similar to Immigrants from North America are Immigrants from Canada (63.7%, a difference of 0.020%), Puget Sound Salish (63.7%, a difference of 0.070%), Immigrants from Grenada (63.6%, a difference of 0.080%), Comanche (63.6%, a difference of 0.090%), and English (63.7%, a difference of 0.10%).
| Demographics | Rating | Rank | In Labor Force | Age > 16 |
| Celtics | 0.1 /100 | #289 | Tragic 63.8% |
| Hungarians | 0.1 /100 | #290 | Tragic 63.8% |
| Nepalese | 0.1 /100 | #291 | Tragic 63.8% |
| Spanish American Indians | 0.1 /100 | #292 | Tragic 63.8% |
| English | 0.1 /100 | #293 | Tragic 63.7% |
| Puget Sound Salish | 0.0 /100 | #294 | Tragic 63.7% |
| Immigrants | Canada | 0.0 /100 | #295 | Tragic 63.7% |
| Immigrants | North America | 0.0 /100 | #296 | Tragic 63.7% |
| Immigrants | Grenada | 0.0 /100 | #297 | Tragic 63.6% |
| Comanche | 0.0 /100 | #298 | Tragic 63.6% |
| Whites/Caucasians | 0.0 /100 | #299 | Tragic 63.6% |
| Immigrants | Azores | 0.0 /100 | #300 | Tragic 63.6% |
| Spanish Americans | 0.0 /100 | #301 | Tragic 63.6% |
| Delaware | 0.0 /100 | #302 | Tragic 63.6% |
| Cree | 0.0 /100 | #303 | Tragic 63.5% |
Demographics Similar to Sioux by In Labor Force | Age > 16
In terms of in labor force | age > 16, the demographic groups most similar to Sioux are Cajun (61.8%, a difference of 0.11%), Cherokee (61.9%, a difference of 0.17%), Cheyenne (62.0%, a difference of 0.22%), Seminole (62.0%, a difference of 0.26%), and Dutch West Indian (61.7%, a difference of 0.27%).
| Demographics | Rating | Rank | In Labor Force | Age > 16 |
| Arapaho | 0.0 /100 | #319 | Tragic 62.1% |
| Yakama | 0.0 /100 | #320 | Tragic 62.1% |
| Americans | 0.0 /100 | #321 | Tragic 62.1% |
| Ottawa | 0.0 /100 | #322 | Tragic 62.0% |
| Seminole | 0.0 /100 | #323 | Tragic 62.0% |
| Cheyenne | 0.0 /100 | #324 | Tragic 62.0% |
| Cherokee | 0.0 /100 | #325 | Tragic 61.9% |
| Sioux | 0.0 /100 | #326 | Tragic 61.8% |
| Cajuns | 0.0 /100 | #327 | Tragic 61.8% |
| Dutch West Indians | 0.0 /100 | #328 | Tragic 61.7% |
| Choctaw | 0.0 /100 | #329 | Tragic 61.5% |
| Creek | 0.0 /100 | #330 | Tragic 61.3% |
| Ute | 0.0 /100 | #331 | Tragic 60.9% |
| Crow | 0.0 /100 | #332 | Tragic 60.8% |
| Paiute | 0.0 /100 | #333 | Tragic 60.7% |