Immigrants from Nigeria vs Immigrants from Portugal In Labor Force | Age 35-44
COMPARE
Immigrants from Nigeria
Immigrants from Portugal
In Labor Force | Age 35-44
In Labor Force | Age 35-44 Comparison
Immigrants from Nigeria
Immigrants from Portugal
84.5%
IN LABOR FORCE | AGE 35-44
73.3/ 100
METRIC RATING
150th/ 347
METRIC RANK
84.4%
IN LABOR FORCE | AGE 35-44
55.2/ 100
METRIC RATING
167th/ 347
METRIC RANK
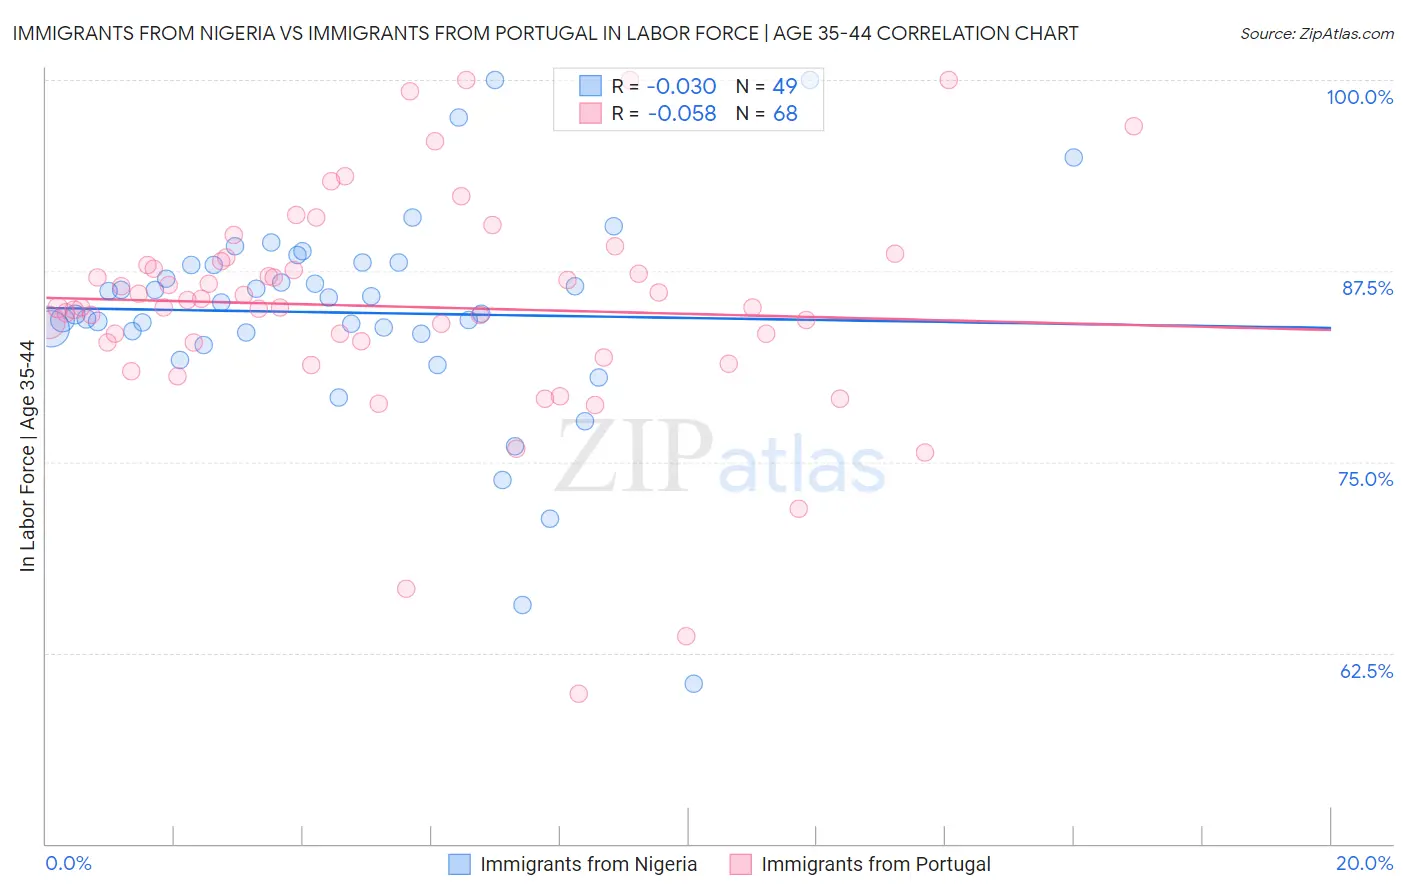
Immigrants from Nigeria vs Immigrants from Portugal In Labor Force | Age 35-44 Correlation Chart
The statistical analysis conducted on geographies consisting of 283,331,334 people shows no correlation between the proportion of Immigrants from Nigeria and labor force participation rate among population between the ages 35 and 44 in the United States with a correlation coefficient (R) of -0.030 and weighted average of 84.5%. Similarly, the statistical analysis conducted on geographies consisting of 174,764,787 people shows a slight negative correlation between the proportion of Immigrants from Portugal and labor force participation rate among population between the ages 35 and 44 in the United States with a correlation coefficient (R) of -0.058 and weighted average of 84.4%, a difference of 0.13%.
In Labor Force | Age 35-44 Correlation Summary
| Measurement | Immigrants from Nigeria | Immigrants from Portugal |
| Minimum | 60.5% | 59.8% |
| Maximum | 100.0% | 100.0% |
| Range | 39.5% | 40.2% |
| Mean | 84.8% | 85.2% |
| Median | 85.4% | 85.1% |
| Interquartile 25% (IQ1) | 83.4% | 82.8% |
| Interquartile 75% (IQ3) | 88.0% | 88.0% |
| Interquartile Range (IQR) | 4.6% | 5.2% |
| Standard Deviation (Sample) | 7.1% | 7.4% |
| Standard Deviation (Population) | 7.0% | 7.3% |
Demographics Similar to Immigrants from Nigeria and Immigrants from Portugal by In Labor Force | Age 35-44
In terms of in labor force | age 35-44, the demographic groups most similar to Immigrants from Nigeria are South American Indian (84.5%, a difference of 0.0%), Okinawan (84.5%, a difference of 0.0%), Romanian (84.5%, a difference of 0.010%), Immigrants from Taiwan (84.5%, a difference of 0.020%), and Trinidadian and Tobagonian (84.5%, a difference of 0.030%). Similarly, the demographic groups most similar to Immigrants from Portugal are Alsatian (84.4%, a difference of 0.0%), Irish (84.4%, a difference of 0.010%), Nigerian (84.4%, a difference of 0.020%), Venezuelan (84.4%, a difference of 0.020%), and Immigrants from Senegal (84.4%, a difference of 0.030%).
| Demographics | Rating | Rank | In Labor Force | Age 35-44 |
| South American Indians | 73.6 /100 | #148 | Good 84.5% |
| Okinawans | 73.5 /100 | #149 | Good 84.5% |
| Immigrants | Nigeria | 73.3 /100 | #150 | Good 84.5% |
| Romanians | 72.1 /100 | #151 | Good 84.5% |
| Immigrants | Taiwan | 71.4 /100 | #152 | Good 84.5% |
| Trinidadians and Tobagonians | 69.5 /100 | #153 | Good 84.5% |
| Iranians | 69.4 /100 | #154 | Good 84.5% |
| Immigrants | Switzerland | 65.9 /100 | #155 | Good 84.5% |
| Immigrants | Israel | 64.3 /100 | #156 | Good 84.4% |
| Immigrants | Austria | 63.8 /100 | #157 | Good 84.4% |
| Jamaicans | 62.7 /100 | #158 | Good 84.4% |
| Immigrants | Senegal | 60.4 /100 | #159 | Good 84.4% |
| Immigrants | Kazakhstan | 60.4 /100 | #160 | Good 84.4% |
| Immigrants | Venezuela | 60.0 /100 | #161 | Good 84.4% |
| Immigrants | Hungary | 59.4 /100 | #162 | Average 84.4% |
| Aleuts | 59.1 /100 | #163 | Average 84.4% |
| Nigerians | 58.9 /100 | #164 | Average 84.4% |
| Venezuelans | 58.1 /100 | #165 | Average 84.4% |
| Alsatians | 55.2 /100 | #166 | Average 84.4% |
| Immigrants | Portugal | 55.2 /100 | #167 | Average 84.4% |
| Irish | 53.1 /100 | #168 | Average 84.4% |