Immigrants from Nigeria vs German Russian In Labor Force | Age 35-44
COMPARE
Immigrants from Nigeria
German Russian
In Labor Force | Age 35-44
In Labor Force | Age 35-44 Comparison
Immigrants from Nigeria
German Russians
84.5%
IN LABOR FORCE | AGE 35-44
73.3/ 100
METRIC RATING
150th/ 347
METRIC RANK
85.2%
IN LABOR FORCE | AGE 35-44
99.8/ 100
METRIC RATING
47th/ 347
METRIC RANK
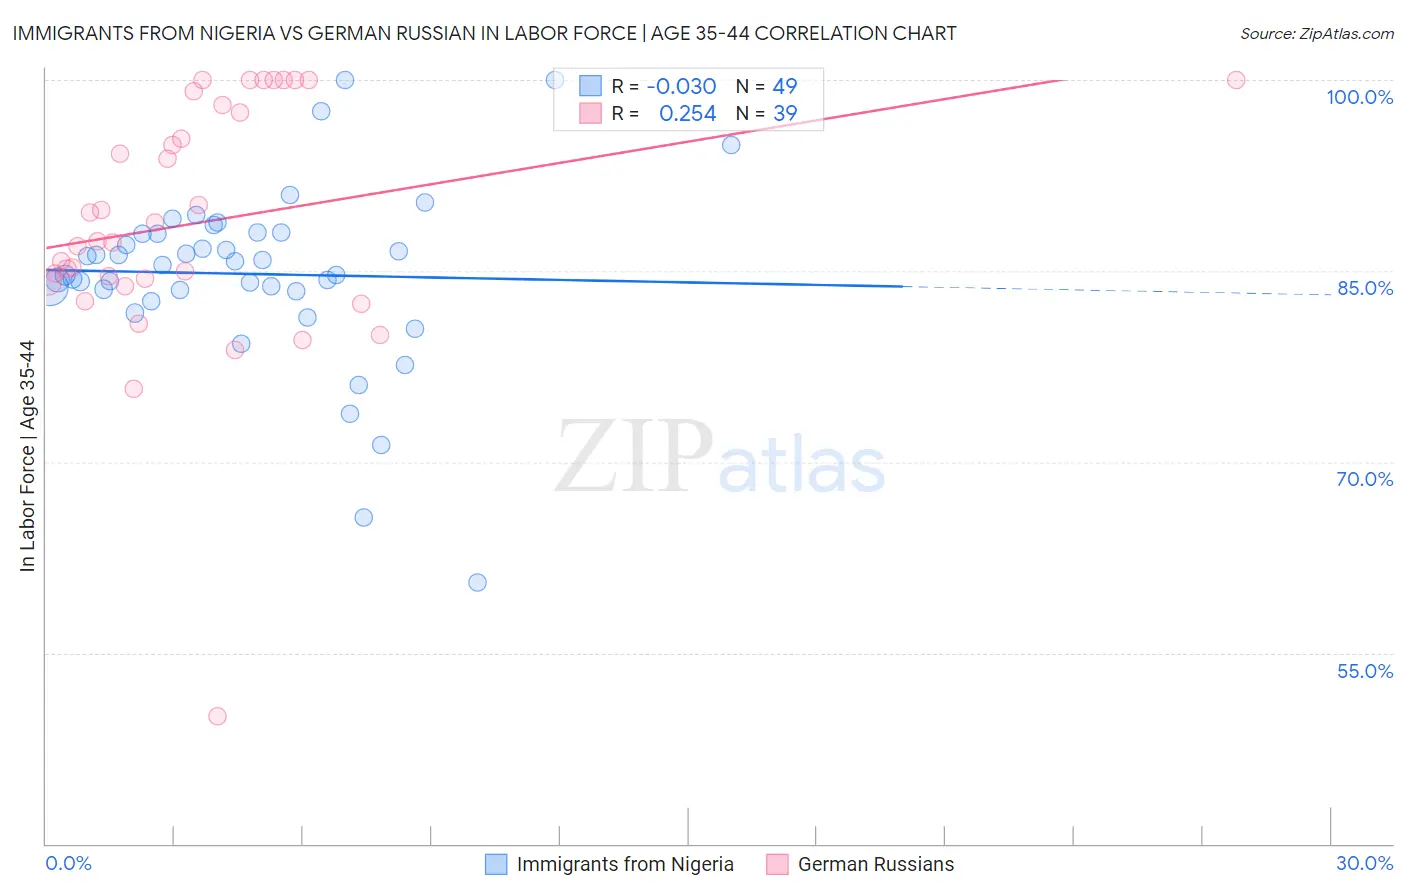
Immigrants from Nigeria vs German Russian In Labor Force | Age 35-44 Correlation Chart
The statistical analysis conducted on geographies consisting of 283,331,334 people shows no correlation between the proportion of Immigrants from Nigeria and labor force participation rate among population between the ages 35 and 44 in the United States with a correlation coefficient (R) of -0.030 and weighted average of 84.5%. Similarly, the statistical analysis conducted on geographies consisting of 96,445,215 people shows a weak positive correlation between the proportion of German Russians and labor force participation rate among population between the ages 35 and 44 in the United States with a correlation coefficient (R) of 0.254 and weighted average of 85.2%, a difference of 0.81%.
In Labor Force | Age 35-44 Correlation Summary
| Measurement | Immigrants from Nigeria | German Russian |
| Minimum | 60.5% | 50.0% |
| Maximum | 100.0% | 100.0% |
| Range | 39.5% | 50.0% |
| Mean | 84.8% | 88.9% |
| Median | 85.4% | 87.4% |
| Interquartile 25% (IQ1) | 83.4% | 84.1% |
| Interquartile 75% (IQ3) | 88.0% | 98.0% |
| Interquartile Range (IQR) | 4.6% | 13.9% |
| Standard Deviation (Sample) | 7.1% | 9.8% |
| Standard Deviation (Population) | 7.0% | 9.7% |
Similar Demographics by In Labor Force | Age 35-44
Demographics Similar to Immigrants from Nigeria by In Labor Force | Age 35-44
In terms of in labor force | age 35-44, the demographic groups most similar to Immigrants from Nigeria are South American Indian (84.5%, a difference of 0.0%), Okinawan (84.5%, a difference of 0.0%), Romanian (84.5%, a difference of 0.010%), Immigrants from Taiwan (84.5%, a difference of 0.020%), and Immigrants from Netherlands (84.5%, a difference of 0.030%).
| Demographics | Rating | Rank | In Labor Force | Age 35-44 |
| Immigrants | Ukraine | 79.7 /100 | #143 | Good 84.6% |
| Immigrants | Jamaica | 79.4 /100 | #144 | Good 84.6% |
| Immigrants | Saudi Arabia | 79.4 /100 | #145 | Good 84.6% |
| Immigrants | Asia | 78.7 /100 | #146 | Good 84.5% |
| Immigrants | Netherlands | 76.6 /100 | #147 | Good 84.5% |
| South American Indians | 73.6 /100 | #148 | Good 84.5% |
| Okinawans | 73.5 /100 | #149 | Good 84.5% |
| Immigrants | Nigeria | 73.3 /100 | #150 | Good 84.5% |
| Romanians | 72.1 /100 | #151 | Good 84.5% |
| Immigrants | Taiwan | 71.4 /100 | #152 | Good 84.5% |
| Trinidadians and Tobagonians | 69.5 /100 | #153 | Good 84.5% |
| Iranians | 69.4 /100 | #154 | Good 84.5% |
| Immigrants | Switzerland | 65.9 /100 | #155 | Good 84.5% |
| Immigrants | Israel | 64.3 /100 | #156 | Good 84.4% |
| Immigrants | Austria | 63.8 /100 | #157 | Good 84.4% |
Demographics Similar to German Russians by In Labor Force | Age 35-44
In terms of in labor force | age 35-44, the demographic groups most similar to German Russians are Cypriot (85.2%, a difference of 0.010%), Immigrants from Hong Kong (85.2%, a difference of 0.010%), Immigrants from Eritrea (85.2%, a difference of 0.010%), Croatian (85.2%, a difference of 0.010%), and Polish (85.2%, a difference of 0.030%).
| Demographics | Rating | Rank | In Labor Force | Age 35-44 |
| Immigrants | Bulgaria | 99.8 /100 | #40 | Exceptional 85.2% |
| Immigrants | Zimbabwe | 99.8 /100 | #41 | Exceptional 85.2% |
| Macedonians | 99.8 /100 | #42 | Exceptional 85.2% |
| Poles | 99.8 /100 | #43 | Exceptional 85.2% |
| Lithuanians | 99.8 /100 | #44 | Exceptional 85.2% |
| Cypriots | 99.8 /100 | #45 | Exceptional 85.2% |
| Immigrants | Hong Kong | 99.8 /100 | #46 | Exceptional 85.2% |
| German Russians | 99.8 /100 | #47 | Exceptional 85.2% |
| Immigrants | Eritrea | 99.7 /100 | #48 | Exceptional 85.2% |
| Croatians | 99.7 /100 | #49 | Exceptional 85.2% |
| Thais | 99.7 /100 | #50 | Exceptional 85.2% |
| Immigrants | Albania | 99.7 /100 | #51 | Exceptional 85.1% |
| Immigrants | Kenya | 99.6 /100 | #52 | Exceptional 85.1% |
| Taiwanese | 99.6 /100 | #53 | Exceptional 85.1% |
| Turks | 99.5 /100 | #54 | Exceptional 85.1% |