Immigrants from Malaysia vs British West Indian In Labor Force | Age 35-44
COMPARE
Immigrants from Malaysia
British West Indian
In Labor Force | Age 35-44
In Labor Force | Age 35-44 Comparison
Immigrants from Malaysia
British West Indians
84.6%
IN LABOR FORCE | AGE 35-44
87.5/ 100
METRIC RATING
135th/ 347
METRIC RANK
84.0%
IN LABOR FORCE | AGE 35-44
5.3/ 100
METRIC RATING
227th/ 347
METRIC RANK
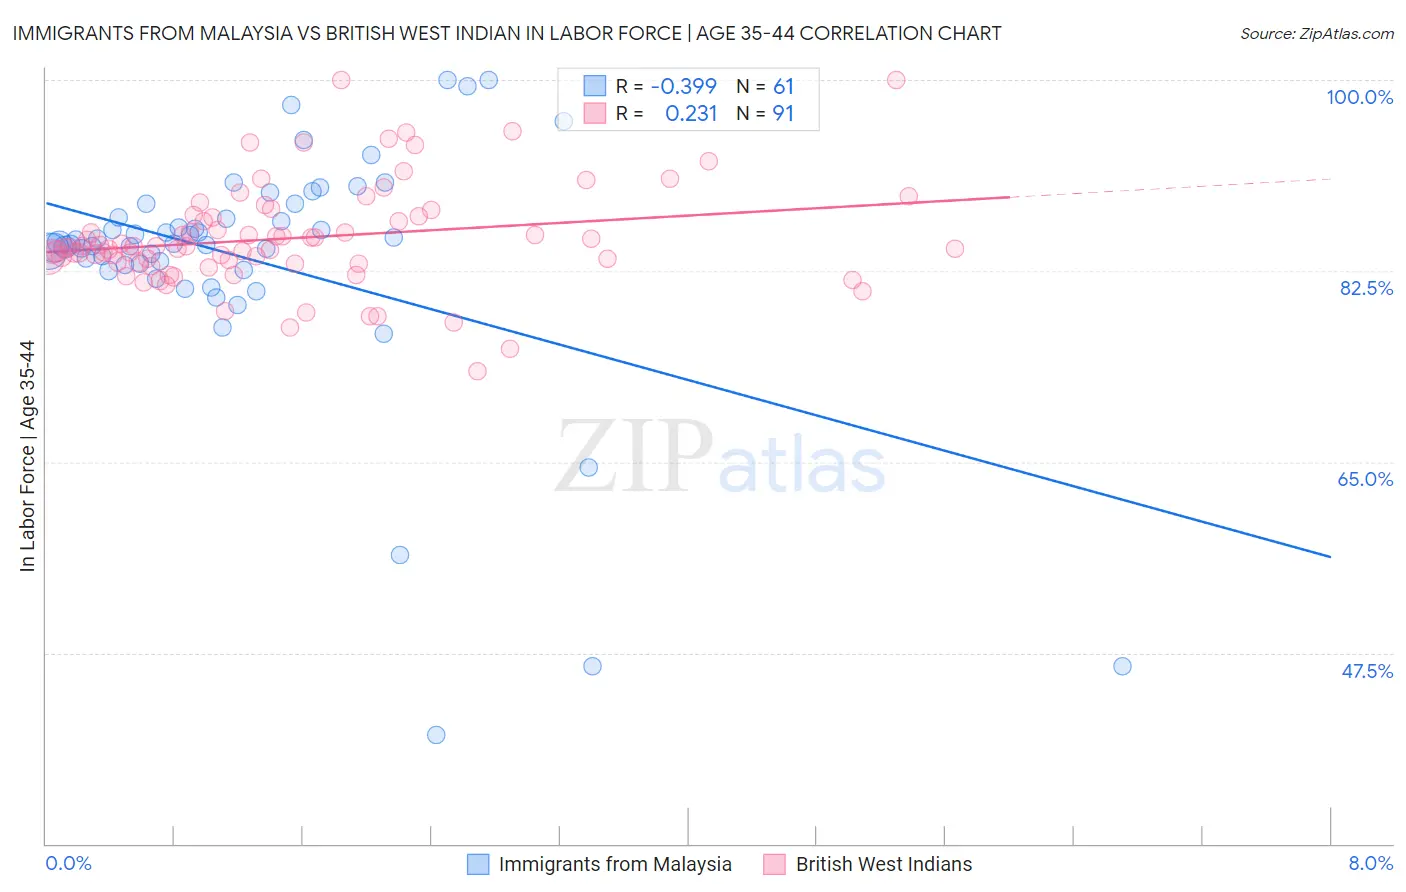
Immigrants from Malaysia vs British West Indian In Labor Force | Age 35-44 Correlation Chart
The statistical analysis conducted on geographies consisting of 197,950,408 people shows a mild negative correlation between the proportion of Immigrants from Malaysia and labor force participation rate among population between the ages 35 and 44 in the United States with a correlation coefficient (R) of -0.399 and weighted average of 84.6%. Similarly, the statistical analysis conducted on geographies consisting of 152,566,094 people shows a weak positive correlation between the proportion of British West Indians and labor force participation rate among population between the ages 35 and 44 in the United States with a correlation coefficient (R) of 0.231 and weighted average of 84.0%, a difference of 0.79%.
In Labor Force | Age 35-44 Correlation Summary
| Measurement | Immigrants from Malaysia | British West Indian |
| Minimum | 40.0% | 73.3% |
| Maximum | 100.0% | 100.0% |
| Range | 60.0% | 26.7% |
| Mean | 83.5% | 85.5% |
| Median | 84.9% | 84.7% |
| Interquartile 25% (IQ1) | 82.8% | 83.3% |
| Interquartile 75% (IQ3) | 88.0% | 87.5% |
| Interquartile Range (IQR) | 5.2% | 4.2% |
| Standard Deviation (Sample) | 11.3% | 4.7% |
| Standard Deviation (Population) | 11.2% | 4.7% |
Similar Demographics by In Labor Force | Age 35-44
Demographics Similar to Immigrants from Malaysia by In Labor Force | Age 35-44
In terms of in labor force | age 35-44, the demographic groups most similar to Immigrants from Malaysia are Argentinean (84.6%, a difference of 0.010%), Immigrants from Korea (84.6%, a difference of 0.010%), Afghan (84.6%, a difference of 0.020%), Palestinian (84.7%, a difference of 0.030%), and Bhutanese (84.7%, a difference of 0.030%).
| Demographics | Rating | Rank | In Labor Force | Age 35-44 |
| Immigrants | Ghana | 90.4 /100 | #128 | Exceptional 84.7% |
| Palestinians | 89.7 /100 | #129 | Excellent 84.7% |
| Bhutanese | 89.7 /100 | #130 | Excellent 84.7% |
| Immigrants | Scotland | 89.6 /100 | #131 | Excellent 84.7% |
| Austrians | 89.4 /100 | #132 | Excellent 84.7% |
| Argentineans | 88.4 /100 | #133 | Excellent 84.6% |
| Immigrants | Korea | 88.2 /100 | #134 | Excellent 84.6% |
| Immigrants | Malaysia | 87.5 /100 | #135 | Excellent 84.6% |
| Afghans | 86.3 /100 | #136 | Excellent 84.6% |
| Immigrants | Chile | 84.6 /100 | #137 | Excellent 84.6% |
| Czechoslovakians | 82.6 /100 | #138 | Excellent 84.6% |
| Immigrants | Zaire | 82.5 /100 | #139 | Excellent 84.6% |
| Immigrants | Japan | 81.4 /100 | #140 | Excellent 84.6% |
| Immigrants | Belgium | 80.8 /100 | #141 | Excellent 84.6% |
| Immigrants | Uruguay | 80.1 /100 | #142 | Excellent 84.6% |
Demographics Similar to British West Indians by In Labor Force | Age 35-44
In terms of in labor force | age 35-44, the demographic groups most similar to British West Indians are Panamanian (84.0%, a difference of 0.0%), Welsh (84.0%, a difference of 0.0%), U.S. Virgin Islander (84.0%, a difference of 0.020%), Immigrants from Burma/Myanmar (84.0%, a difference of 0.020%), and Immigrants from Thailand (84.0%, a difference of 0.020%).
| Demographics | Rating | Rank | In Labor Force | Age 35-44 |
| French | 7.5 /100 | #220 | Tragic 84.0% |
| Icelanders | 6.7 /100 | #221 | Tragic 84.0% |
| Assyrians/Chaldeans/Syriacs | 6.6 /100 | #222 | Tragic 84.0% |
| Immigrants | Panama | 6.4 /100 | #223 | Tragic 84.0% |
| U.S. Virgin Islanders | 6.1 /100 | #224 | Tragic 84.0% |
| Immigrants | Burma/Myanmar | 6.1 /100 | #225 | Tragic 84.0% |
| Panamanians | 5.4 /100 | #226 | Tragic 84.0% |
| British West Indians | 5.3 /100 | #227 | Tragic 84.0% |
| Welsh | 5.3 /100 | #228 | Tragic 84.0% |
| Immigrants | Thailand | 4.7 /100 | #229 | Tragic 84.0% |
| Immigrants | Iraq | 3.7 /100 | #230 | Tragic 83.9% |
| Scottish | 3.2 /100 | #231 | Tragic 83.9% |
| Native Hawaiians | 3.0 /100 | #232 | Tragic 83.9% |
| Immigrants | Germany | 2.8 /100 | #233 | Tragic 83.9% |
| Immigrants | Oceania | 2.6 /100 | #234 | Tragic 83.9% |