Immigrants from Lithuania vs Blackfeet In Labor Force | Age 35-44
COMPARE
Immigrants from Lithuania
Blackfeet
In Labor Force | Age 35-44
In Labor Force | Age 35-44 Comparison
Immigrants from Lithuania
Blackfeet
85.4%
IN LABOR FORCE | AGE 35-44
99.9/ 100
METRIC RATING
27th/ 347
METRIC RANK
81.9%
IN LABOR FORCE | AGE 35-44
0.0/ 100
METRIC RATING
310th/ 347
METRIC RANK
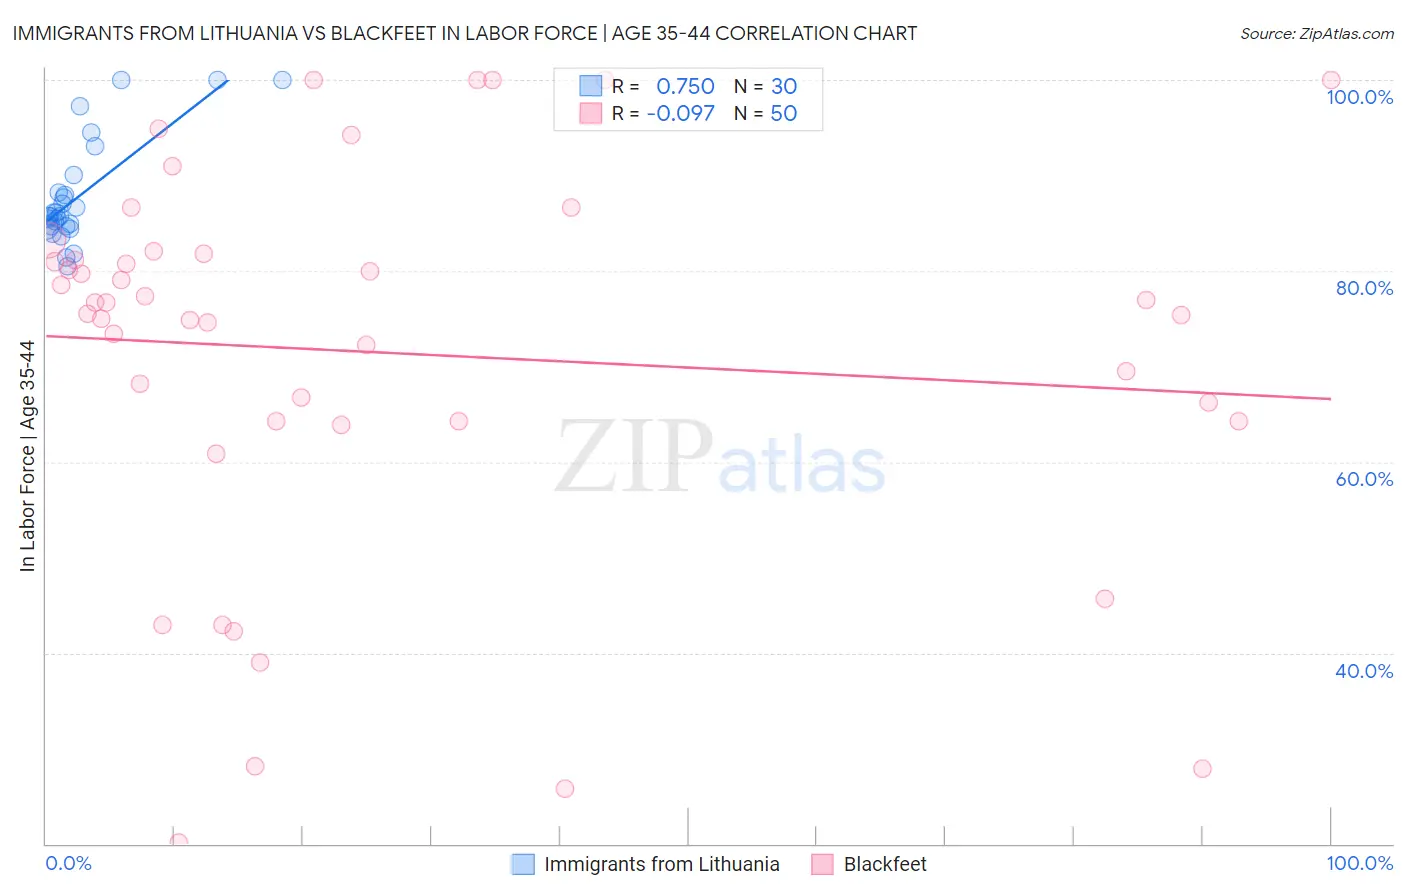
Immigrants from Lithuania vs Blackfeet In Labor Force | Age 35-44 Correlation Chart
The statistical analysis conducted on geographies consisting of 117,719,868 people shows a strong positive correlation between the proportion of Immigrants from Lithuania and labor force participation rate among population between the ages 35 and 44 in the United States with a correlation coefficient (R) of 0.750 and weighted average of 85.4%. Similarly, the statistical analysis conducted on geographies consisting of 309,495,492 people shows a slight negative correlation between the proportion of Blackfeet and labor force participation rate among population between the ages 35 and 44 in the United States with a correlation coefficient (R) of -0.097 and weighted average of 81.9%, a difference of 4.3%.
In Labor Force | Age 35-44 Correlation Summary
| Measurement | Immigrants from Lithuania | Blackfeet |
| Minimum | 80.5% | 20.1% |
| Maximum | 100.0% | 100.0% |
| Range | 19.5% | 79.9% |
| Mean | 87.7% | 71.4% |
| Median | 85.8% | 76.0% |
| Interquartile 25% (IQ1) | 84.7% | 64.2% |
| Interquartile 75% (IQ3) | 88.2% | 81.8% |
| Interquartile Range (IQR) | 3.6% | 17.6% |
| Standard Deviation (Sample) | 5.5% | 20.3% |
| Standard Deviation (Population) | 5.4% | 20.1% |
Similar Demographics by In Labor Force | Age 35-44
Demographics Similar to Immigrants from Lithuania by In Labor Force | Age 35-44
In terms of in labor force | age 35-44, the demographic groups most similar to Immigrants from Lithuania are Paraguayan (85.4%, a difference of 0.0%), Immigrants from Liberia (85.4%, a difference of 0.0%), Immigrants from Greece (85.3%, a difference of 0.010%), Latvian (85.4%, a difference of 0.020%), and Cambodian (85.3%, a difference of 0.050%).
| Demographics | Rating | Rank | In Labor Force | Age 35-44 |
| Immigrants | Serbia | 100.0 /100 | #20 | Exceptional 85.5% |
| Bulgarians | 100.0 /100 | #21 | Exceptional 85.5% |
| Immigrants | Bosnia and Herzegovina | 100.0 /100 | #22 | Exceptional 85.4% |
| Immigrants | Eastern Africa | 100.0 /100 | #23 | Exceptional 85.4% |
| Latvians | 99.9 /100 | #24 | Exceptional 85.4% |
| Paraguayans | 99.9 /100 | #25 | Exceptional 85.4% |
| Immigrants | Liberia | 99.9 /100 | #26 | Exceptional 85.4% |
| Immigrants | Lithuania | 99.9 /100 | #27 | Exceptional 85.4% |
| Immigrants | Greece | 99.9 /100 | #28 | Exceptional 85.3% |
| Cambodians | 99.9 /100 | #29 | Exceptional 85.3% |
| Bermudans | 99.9 /100 | #30 | Exceptional 85.3% |
| Czechs | 99.9 /100 | #31 | Exceptional 85.3% |
| Immigrants | India | 99.9 /100 | #32 | Exceptional 85.3% |
| Ugandans | 99.9 /100 | #33 | Exceptional 85.3% |
| Immigrants | Nepal | 99.9 /100 | #34 | Exceptional 85.3% |
Demographics Similar to Blackfeet by In Labor Force | Age 35-44
In terms of in labor force | age 35-44, the demographic groups most similar to Blackfeet are Cree (82.0%, a difference of 0.12%), Immigrants from Central America (82.0%, a difference of 0.13%), Colville (81.7%, a difference of 0.17%), Hispanic or Latino (82.1%, a difference of 0.28%), and Alaska Native (81.6%, a difference of 0.32%).
| Demographics | Rating | Rank | In Labor Force | Age 35-44 |
| Nepalese | 0.0 /100 | #303 | Tragic 82.4% |
| Marshallese | 0.0 /100 | #304 | Tragic 82.4% |
| Shoshone | 0.0 /100 | #305 | Tragic 82.2% |
| Blacks/African Americans | 0.0 /100 | #306 | Tragic 82.2% |
| Hispanics or Latinos | 0.0 /100 | #307 | Tragic 82.1% |
| Immigrants | Central America | 0.0 /100 | #308 | Tragic 82.0% |
| Cree | 0.0 /100 | #309 | Tragic 82.0% |
| Blackfeet | 0.0 /100 | #310 | Tragic 81.9% |
| Colville | 0.0 /100 | #311 | Tragic 81.7% |
| Alaska Natives | 0.0 /100 | #312 | Tragic 81.6% |
| Mexicans | 0.0 /100 | #313 | Tragic 81.6% |
| Cajuns | 0.0 /100 | #314 | Tragic 81.5% |
| Immigrants | Mexico | 0.0 /100 | #315 | Tragic 81.5% |
| Comanche | 0.0 /100 | #316 | Tragic 81.5% |
| Cherokee | 0.0 /100 | #317 | Tragic 81.4% |