Immigrants from Latin America vs Slavic In Labor Force | Age 45-54
COMPARE
Immigrants from Latin America
Slavic
In Labor Force | Age 45-54
In Labor Force | Age 45-54 Comparison
Immigrants from Latin America
Slavs
81.0%
IN LABOR FORCE | AGE 45-54
0.0/ 100
METRIC RATING
280th/ 347
METRIC RANK
82.9%
IN LABOR FORCE | AGE 45-54
71.5/ 100
METRIC RATING
152nd/ 347
METRIC RANK
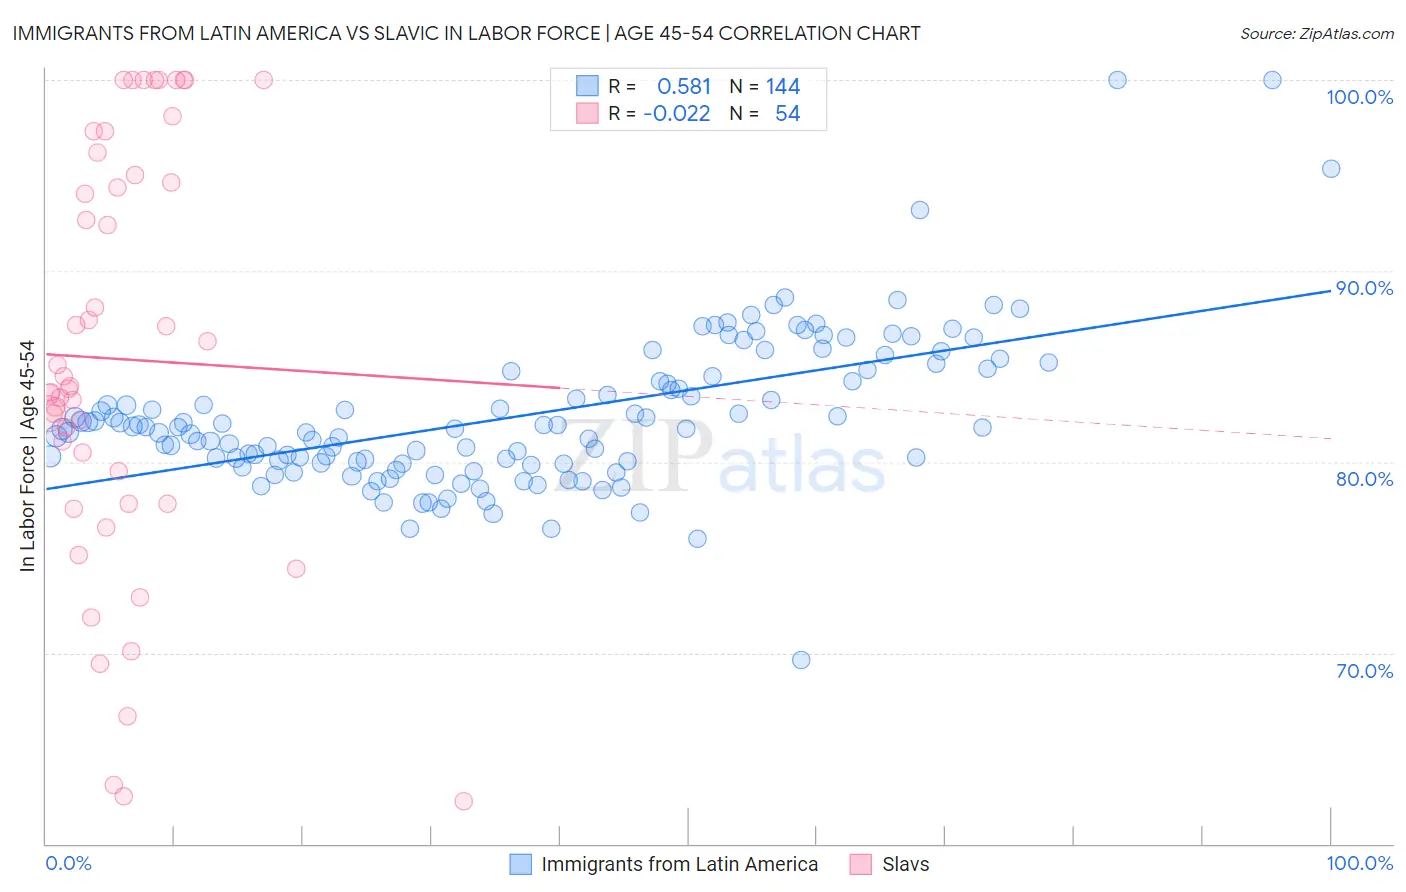
Immigrants from Latin America vs Slavic In Labor Force | Age 45-54 Correlation Chart
The statistical analysis conducted on geographies consisting of 557,910,063 people shows a substantial positive correlation between the proportion of Immigrants from Latin America and labor force participation rate among population between the ages 45 and 54 in the United States with a correlation coefficient (R) of 0.581 and weighted average of 81.0%. Similarly, the statistical analysis conducted on geographies consisting of 270,794,897 people shows no correlation between the proportion of Slavs and labor force participation rate among population between the ages 45 and 54 in the United States with a correlation coefficient (R) of -0.022 and weighted average of 82.9%, a difference of 2.4%.
In Labor Force | Age 45-54 Correlation Summary
| Measurement | Immigrants from Latin America | Slavic |
| Minimum | 69.6% | 62.2% |
| Maximum | 100.0% | 100.0% |
| Range | 30.4% | 37.8% |
| Mean | 82.4% | 85.4% |
| Median | 81.8% | 83.9% |
| Interquartile 25% (IQ1) | 80.0% | 77.8% |
| Interquartile 75% (IQ3) | 84.6% | 95.0% |
| Interquartile Range (IQR) | 4.6% | 17.2% |
| Standard Deviation (Sample) | 4.0% | 10.9% |
| Standard Deviation (Population) | 4.0% | 10.8% |
Similar Demographics by In Labor Force | Age 45-54
Demographics Similar to Immigrants from Latin America by In Labor Force | Age 45-54
In terms of in labor force | age 45-54, the demographic groups most similar to Immigrants from Latin America are Immigrants from Grenada (81.0%, a difference of 0.0%), Aleut (81.0%, a difference of 0.070%), Immigrants from Guatemala (81.1%, a difference of 0.11%), Immigrants from Micronesia (81.1%, a difference of 0.11%), and Guatemalan (81.2%, a difference of 0.19%).
| Demographics | Rating | Rank | In Labor Force | Age 45-54 |
| Chippewa | 0.0 /100 | #273 | Tragic 81.3% |
| British West Indians | 0.0 /100 | #274 | Tragic 81.2% |
| Immigrants | Nonimmigrants | 0.0 /100 | #275 | Tragic 81.2% |
| U.S. Virgin Islanders | 0.0 /100 | #276 | Tragic 81.2% |
| Guatemalans | 0.0 /100 | #277 | Tragic 81.2% |
| Immigrants | Guatemala | 0.0 /100 | #278 | Tragic 81.1% |
| Immigrants | Micronesia | 0.0 /100 | #279 | Tragic 81.1% |
| Immigrants | Latin America | 0.0 /100 | #280 | Tragic 81.0% |
| Immigrants | Grenada | 0.0 /100 | #281 | Tragic 81.0% |
| Aleuts | 0.0 /100 | #282 | Tragic 81.0% |
| French American Indians | 0.0 /100 | #283 | Tragic 80.8% |
| Belizeans | 0.0 /100 | #284 | Tragic 80.8% |
| Delaware | 0.0 /100 | #285 | Tragic 80.8% |
| Immigrants | Dominica | 0.0 /100 | #286 | Tragic 80.8% |
| Vietnamese | 0.0 /100 | #287 | Tragic 80.8% |
Demographics Similar to Slavs by In Labor Force | Age 45-54
In terms of in labor force | age 45-54, the demographic groups most similar to Slavs are Immigrants from Netherlands (82.9%, a difference of 0.010%), Korean (82.9%, a difference of 0.010%), Immigrants from Indonesia (82.9%, a difference of 0.010%), Immigrants from Ghana (82.9%, a difference of 0.010%), and Immigrants from Sweden (82.9%, a difference of 0.020%).
| Demographics | Rating | Rank | In Labor Force | Age 45-54 |
| Romanians | 75.4 /100 | #145 | Good 83.0% |
| Immigrants | France | 75.3 /100 | #146 | Good 83.0% |
| Czechoslovakians | 74.8 /100 | #147 | Good 83.0% |
| Immigrants | Nigeria | 74.1 /100 | #148 | Good 83.0% |
| Immigrants | Sweden | 73.3 /100 | #149 | Good 82.9% |
| Immigrants | Netherlands | 72.6 /100 | #150 | Good 82.9% |
| Koreans | 71.9 /100 | #151 | Good 82.9% |
| Slavs | 71.5 /100 | #152 | Good 82.9% |
| Immigrants | Indonesia | 70.6 /100 | #153 | Good 82.9% |
| Immigrants | Ghana | 70.3 /100 | #154 | Good 82.9% |
| Immigrants | Philippines | 69.0 /100 | #155 | Good 82.9% |
| Immigrants | Saudi Arabia | 68.8 /100 | #156 | Good 82.9% |
| Immigrants | Australia | 68.2 /100 | #157 | Good 82.9% |
| Immigrants | Southern Europe | 67.8 /100 | #158 | Good 82.9% |
| Immigrants | Austria | 64.6 /100 | #159 | Good 82.9% |