Immigrants from Latin America vs Scottish In Labor Force | Age 30-34
COMPARE
Immigrants from Latin America
Scottish
In Labor Force | Age 30-34
In Labor Force | Age 30-34 Comparison
Immigrants from Latin America
Scottish
83.1%
IN LABOR FORCE | AGE 30-34
0.0/ 100
METRIC RATING
286th/ 347
METRIC RANK
84.2%
IN LABOR FORCE | AGE 30-34
3.1/ 100
METRIC RATING
225th/ 347
METRIC RANK
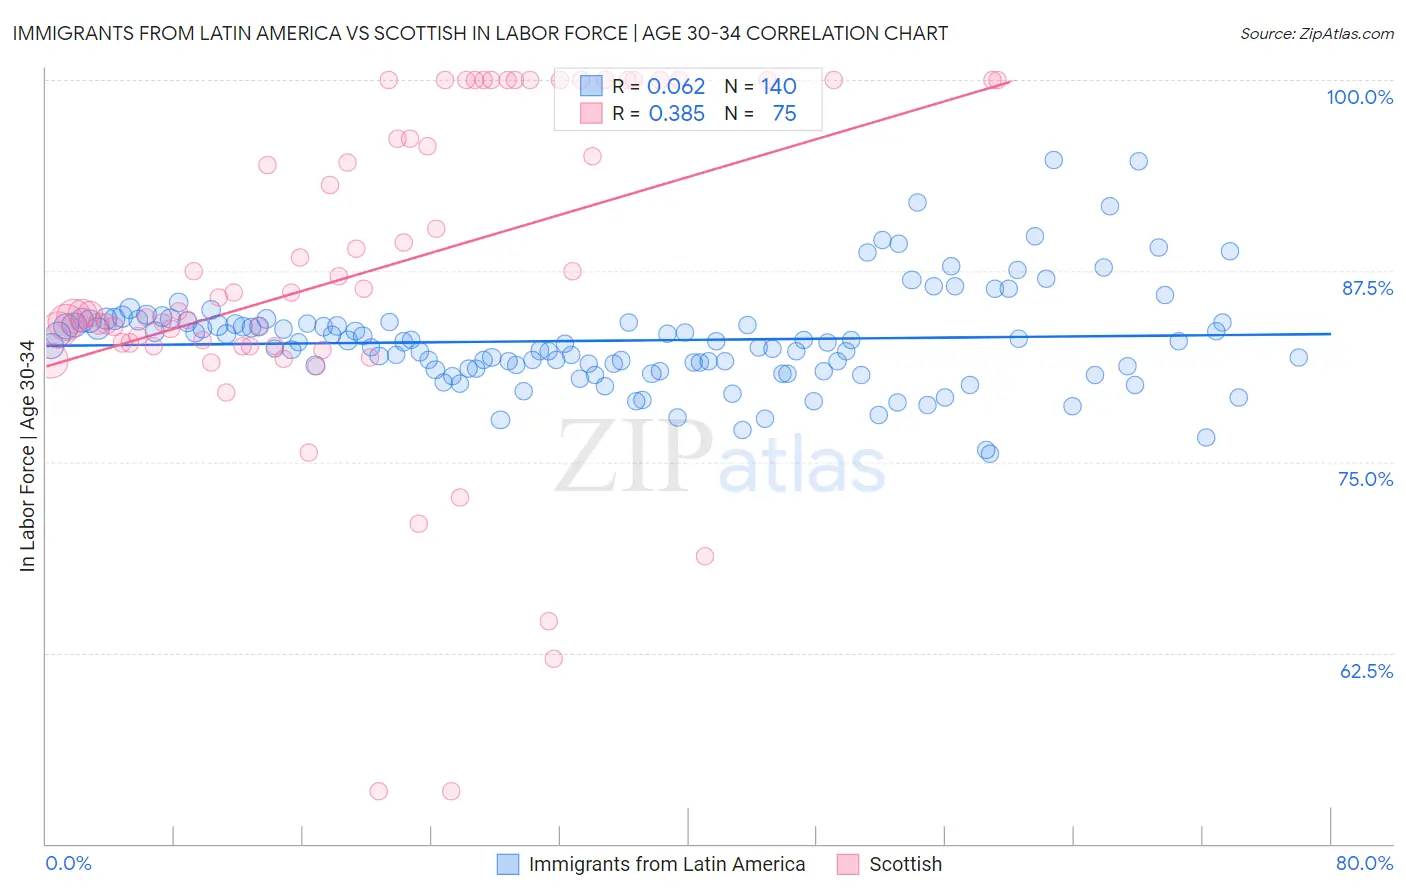
Immigrants from Latin America vs Scottish In Labor Force | Age 30-34 Correlation Chart
The statistical analysis conducted on geographies consisting of 557,588,072 people shows a slight positive correlation between the proportion of Immigrants from Latin America and labor force participation rate among population between the ages 30 and 34 in the United States with a correlation coefficient (R) of 0.062 and weighted average of 83.1%. Similarly, the statistical analysis conducted on geographies consisting of 565,856,889 people shows a mild positive correlation between the proportion of Scottish and labor force participation rate among population between the ages 30 and 34 in the United States with a correlation coefficient (R) of 0.385 and weighted average of 84.2%, a difference of 1.3%.
In Labor Force | Age 30-34 Correlation Summary
| Measurement | Immigrants from Latin America | Scottish |
| Minimum | 75.6% | 53.4% |
| Maximum | 94.8% | 100.0% |
| Range | 19.2% | 46.6% |
| Mean | 82.9% | 87.5% |
| Median | 82.8% | 85.8% |
| Interquartile 25% (IQ1) | 81.1% | 82.6% |
| Interquartile 75% (IQ3) | 84.2% | 100.0% |
| Interquartile Range (IQR) | 3.1% | 17.4% |
| Standard Deviation (Sample) | 3.2% | 10.8% |
| Standard Deviation (Population) | 3.2% | 10.7% |
Similar Demographics by In Labor Force | Age 30-34
Demographics Similar to Immigrants from Latin America by In Labor Force | Age 30-34
In terms of in labor force | age 30-34, the demographic groups most similar to Immigrants from Latin America are Immigrants from Belize (83.2%, a difference of 0.060%), Cree (83.2%, a difference of 0.060%), Native Hawaiian (83.0%, a difference of 0.10%), Assyrian/Chaldean/Syriac (83.2%, a difference of 0.11%), and Mexican American Indian (83.2%, a difference of 0.12%).
| Demographics | Rating | Rank | In Labor Force | Age 30-34 |
| Immigrants | Fiji | 0.0 /100 | #279 | Tragic 83.4% |
| Africans | 0.0 /100 | #280 | Tragic 83.4% |
| Samoans | 0.0 /100 | #281 | Tragic 83.3% |
| Mexican American Indians | 0.0 /100 | #282 | Tragic 83.2% |
| Assyrians/Chaldeans/Syriacs | 0.0 /100 | #283 | Tragic 83.2% |
| Immigrants | Belize | 0.0 /100 | #284 | Tragic 83.2% |
| Cree | 0.0 /100 | #285 | Tragic 83.2% |
| Immigrants | Latin America | 0.0 /100 | #286 | Tragic 83.1% |
| Native Hawaiians | 0.0 /100 | #287 | Tragic 83.0% |
| Central American Indians | 0.0 /100 | #288 | Tragic 83.0% |
| Hawaiians | 0.0 /100 | #289 | Tragic 83.0% |
| Blackfeet | 0.0 /100 | #290 | Tragic 82.8% |
| Potawatomi | 0.0 /100 | #291 | Tragic 82.8% |
| Blacks/African Americans | 0.0 /100 | #292 | Tragic 82.8% |
| Nepalese | 0.0 /100 | #293 | Tragic 82.7% |
Demographics Similar to Scottish by In Labor Force | Age 30-34
In terms of in labor force | age 30-34, the demographic groups most similar to Scottish are Immigrants from El Salvador (84.2%, a difference of 0.0%), Immigrants from Cuba (84.2%, a difference of 0.010%), Immigrants from Haiti (84.2%, a difference of 0.010%), Cuban (84.2%, a difference of 0.020%), and Welsh (84.2%, a difference of 0.020%).
| Demographics | Rating | Rank | In Labor Force | Age 30-34 |
| Immigrants | Panama | 6.3 /100 | #218 | Tragic 84.3% |
| Swiss | 5.8 /100 | #219 | Tragic 84.3% |
| Danes | 5.3 /100 | #220 | Tragic 84.3% |
| Salvadorans | 3.8 /100 | #221 | Tragic 84.2% |
| Panamanians | 3.8 /100 | #222 | Tragic 84.2% |
| Immigrants | Laos | 3.6 /100 | #223 | Tragic 84.2% |
| Cubans | 3.4 /100 | #224 | Tragic 84.2% |
| Scottish | 3.1 /100 | #225 | Tragic 84.2% |
| Immigrants | El Salvador | 3.0 /100 | #226 | Tragic 84.2% |
| Immigrants | Cuba | 3.0 /100 | #227 | Tragic 84.2% |
| Immigrants | Haiti | 2.8 /100 | #228 | Tragic 84.2% |
| Welsh | 2.7 /100 | #229 | Tragic 84.2% |
| Immigrants | Bahamas | 2.6 /100 | #230 | Tragic 84.1% |
| Malaysians | 2.2 /100 | #231 | Tragic 84.1% |
| Immigrants | Immigrants | 2.0 /100 | #232 | Tragic 84.1% |