Immigrants from Haiti vs Immigrants from Uruguay In Labor Force | Age 25-29
COMPARE
Immigrants from Haiti
Immigrants from Uruguay
In Labor Force | Age 25-29
In Labor Force | Age 25-29 Comparison
Immigrants from Haiti
Immigrants from Uruguay
83.7%
IN LABOR FORCE | AGE 25-29
0.2/ 100
METRIC RATING
256th/ 347
METRIC RANK
84.9%
IN LABOR FORCE | AGE 25-29
84.0/ 100
METRIC RATING
127th/ 347
METRIC RANK
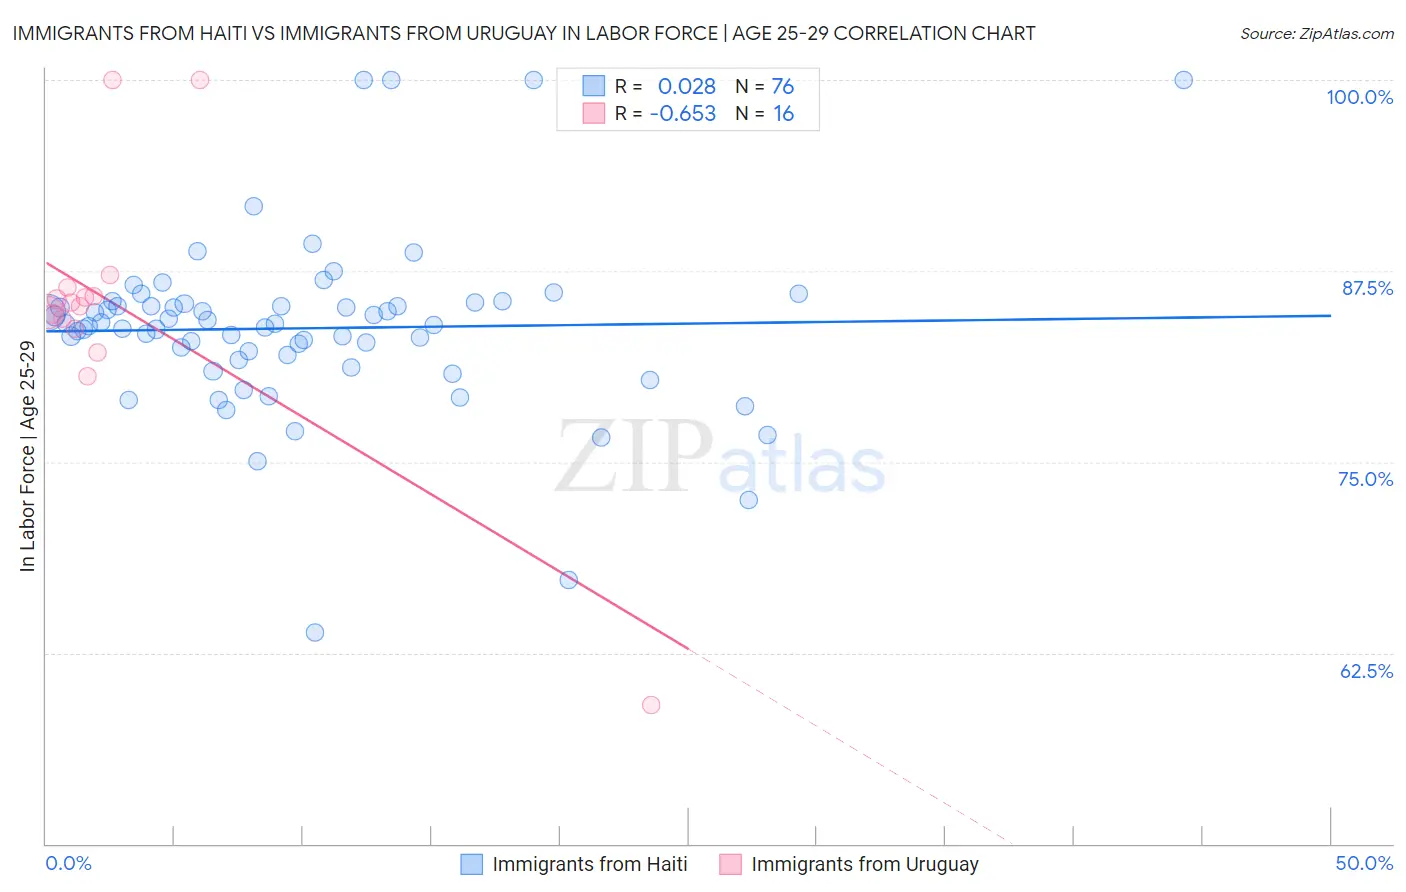
Immigrants from Haiti vs Immigrants from Uruguay In Labor Force | Age 25-29 Correlation Chart
The statistical analysis conducted on geographies consisting of 225,226,191 people shows no correlation between the proportion of Immigrants from Haiti and labor force participation rate among population between the ages 25 and 29 in the United States with a correlation coefficient (R) of 0.028 and weighted average of 83.7%. Similarly, the statistical analysis conducted on geographies consisting of 133,247,339 people shows a significant negative correlation between the proportion of Immigrants from Uruguay and labor force participation rate among population between the ages 25 and 29 in the United States with a correlation coefficient (R) of -0.653 and weighted average of 84.9%, a difference of 1.5%.
In Labor Force | Age 25-29 Correlation Summary
| Measurement | Immigrants from Haiti | Immigrants from Uruguay |
| Minimum | 63.8% | 59.1% |
| Maximum | 100.0% | 100.0% |
| Range | 36.2% | 40.9% |
| Mean | 83.7% | 85.1% |
| Median | 84.0% | 85.3% |
| Interquartile 25% (IQ1) | 81.8% | 84.0% |
| Interquartile 75% (IQ3) | 85.3% | 86.1% |
| Interquartile Range (IQR) | 3.5% | 2.1% |
| Standard Deviation (Sample) | 5.8% | 8.8% |
| Standard Deviation (Population) | 5.8% | 8.5% |
Similar Demographics by In Labor Force | Age 25-29
Demographics Similar to Immigrants from Haiti by In Labor Force | Age 25-29
In terms of in labor force | age 25-29, the demographic groups most similar to Immigrants from Haiti are Haitian (83.7%, a difference of 0.010%), Delaware (83.7%, a difference of 0.010%), Guatemalan (83.7%, a difference of 0.020%), Immigrants from Trinidad and Tobago (83.7%, a difference of 0.020%), and Spaniard (83.7%, a difference of 0.020%).
| Demographics | Rating | Rank | In Labor Force | Age 25-29 |
| Hmong | 0.3 /100 | #249 | Tragic 83.7% |
| Central Americans | 0.2 /100 | #250 | Tragic 83.7% |
| Bahamians | 0.2 /100 | #251 | Tragic 83.7% |
| Guatemalans | 0.2 /100 | #252 | Tragic 83.7% |
| Immigrants | Trinidad and Tobago | 0.2 /100 | #253 | Tragic 83.7% |
| Spaniards | 0.2 /100 | #254 | Tragic 83.7% |
| Haitians | 0.2 /100 | #255 | Tragic 83.7% |
| Immigrants | Haiti | 0.2 /100 | #256 | Tragic 83.7% |
| Delaware | 0.2 /100 | #257 | Tragic 83.7% |
| Immigrants | Guatemala | 0.1 /100 | #258 | Tragic 83.6% |
| Spanish | 0.1 /100 | #259 | Tragic 83.6% |
| Immigrants | Bahamas | 0.1 /100 | #260 | Tragic 83.6% |
| Pennsylvania Germans | 0.1 /100 | #261 | Tragic 83.6% |
| Immigrants | Fiji | 0.1 /100 | #262 | Tragic 83.6% |
| West Indians | 0.1 /100 | #263 | Tragic 83.5% |
Demographics Similar to Immigrants from Uruguay by In Labor Force | Age 25-29
In terms of in labor force | age 25-29, the demographic groups most similar to Immigrants from Uruguay are Dutch (84.9%, a difference of 0.010%), Immigrants from Iran (84.9%, a difference of 0.010%), Uruguayan (84.9%, a difference of 0.010%), Immigrants from Singapore (84.9%, a difference of 0.010%), and Australian (84.9%, a difference of 0.010%).
| Demographics | Rating | Rank | In Labor Force | Age 25-29 |
| Immigrants | South Africa | 86.1 /100 | #120 | Excellent 84.9% |
| Immigrants | Chile | 85.6 /100 | #121 | Excellent 84.9% |
| Scandinavians | 85.1 /100 | #122 | Excellent 84.9% |
| Dutch | 84.9 /100 | #123 | Excellent 84.9% |
| Immigrants | Iran | 84.8 /100 | #124 | Excellent 84.9% |
| Uruguayans | 84.7 /100 | #125 | Excellent 84.9% |
| Immigrants | Singapore | 84.4 /100 | #126 | Excellent 84.9% |
| Immigrants | Uruguay | 84.0 /100 | #127 | Excellent 84.9% |
| Australians | 83.6 /100 | #128 | Excellent 84.9% |
| Immigrants | Russia | 81.6 /100 | #129 | Excellent 84.9% |
| Northern Europeans | 81.3 /100 | #130 | Excellent 84.9% |
| Iranians | 78.1 /100 | #131 | Good 84.8% |
| Romanians | 77.7 /100 | #132 | Good 84.8% |
| Asians | 77.7 /100 | #133 | Good 84.8% |
| Syrians | 76.5 /100 | #134 | Good 84.8% |