Immigrants from Haiti vs Armenian In Labor Force | Age 25-29
COMPARE
Immigrants from Haiti
Armenian
In Labor Force | Age 25-29
In Labor Force | Age 25-29 Comparison
Immigrants from Haiti
Armenians
83.7%
IN LABOR FORCE | AGE 25-29
0.2/ 100
METRIC RATING
256th/ 347
METRIC RANK
84.8%
IN LABOR FORCE | AGE 25-29
72.7/ 100
METRIC RATING
138th/ 347
METRIC RANK
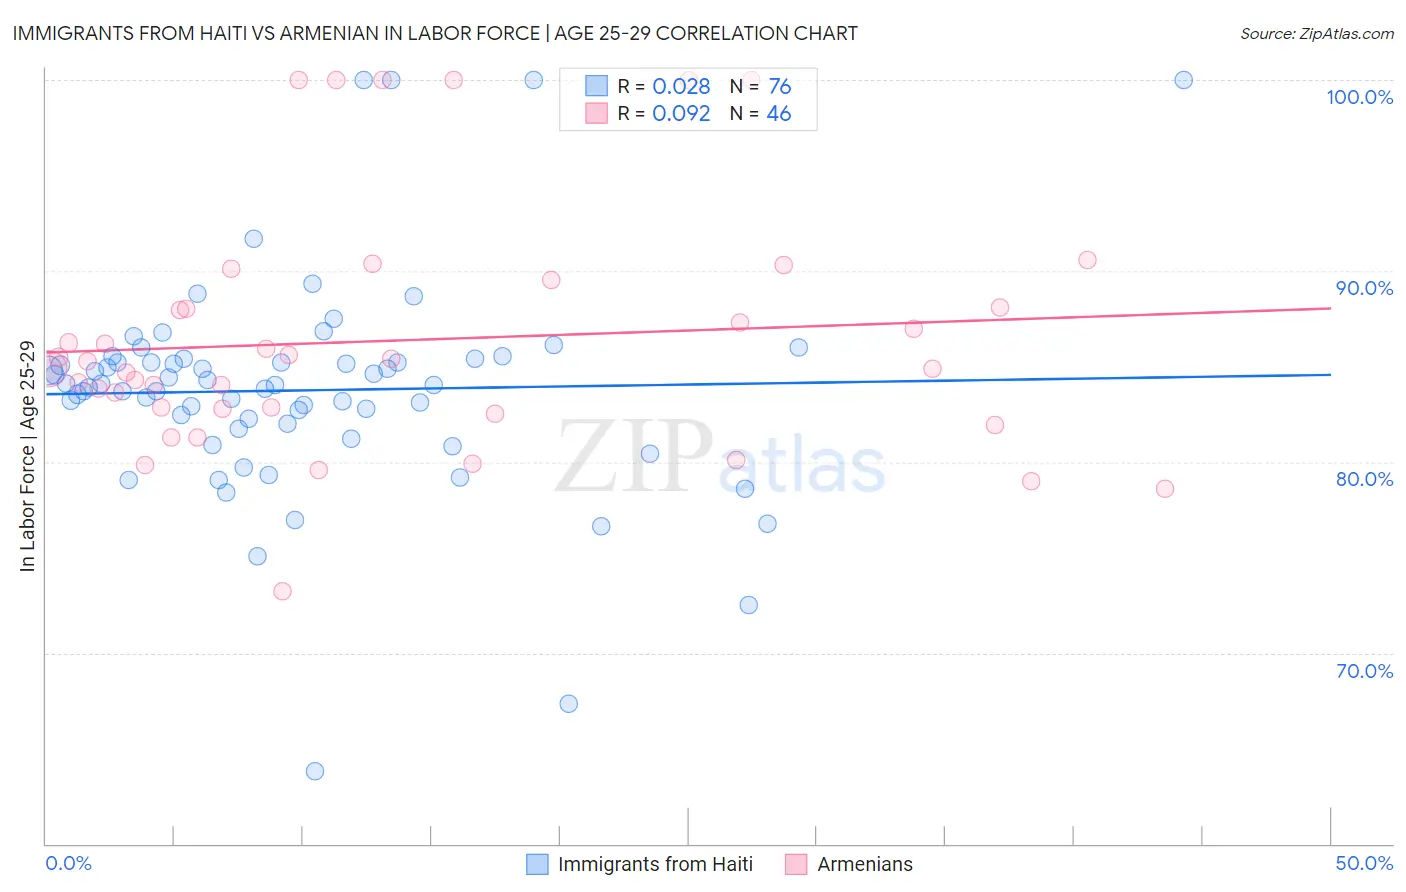
Immigrants from Haiti vs Armenian In Labor Force | Age 25-29 Correlation Chart
The statistical analysis conducted on geographies consisting of 225,226,191 people shows no correlation between the proportion of Immigrants from Haiti and labor force participation rate among population between the ages 25 and 29 in the United States with a correlation coefficient (R) of 0.028 and weighted average of 83.7%. Similarly, the statistical analysis conducted on geographies consisting of 310,863,376 people shows a slight positive correlation between the proportion of Armenians and labor force participation rate among population between the ages 25 and 29 in the United States with a correlation coefficient (R) of 0.092 and weighted average of 84.8%, a difference of 1.4%.
In Labor Force | Age 25-29 Correlation Summary
| Measurement | Immigrants from Haiti | Armenian |
| Minimum | 63.8% | 73.2% |
| Maximum | 100.0% | 100.0% |
| Range | 36.2% | 26.8% |
| Mean | 83.7% | 86.4% |
| Median | 84.0% | 85.1% |
| Interquartile 25% (IQ1) | 81.8% | 82.8% |
| Interquartile 75% (IQ3) | 85.3% | 88.1% |
| Interquartile Range (IQR) | 3.5% | 5.3% |
| Standard Deviation (Sample) | 5.8% | 6.4% |
| Standard Deviation (Population) | 5.8% | 6.3% |
Similar Demographics by In Labor Force | Age 25-29
Demographics Similar to Immigrants from Haiti by In Labor Force | Age 25-29
In terms of in labor force | age 25-29, the demographic groups most similar to Immigrants from Haiti are Haitian (83.7%, a difference of 0.010%), Delaware (83.7%, a difference of 0.010%), Guatemalan (83.7%, a difference of 0.020%), Immigrants from Trinidad and Tobago (83.7%, a difference of 0.020%), and Spaniard (83.7%, a difference of 0.020%).
| Demographics | Rating | Rank | In Labor Force | Age 25-29 |
| Hmong | 0.3 /100 | #249 | Tragic 83.7% |
| Central Americans | 0.2 /100 | #250 | Tragic 83.7% |
| Bahamians | 0.2 /100 | #251 | Tragic 83.7% |
| Guatemalans | 0.2 /100 | #252 | Tragic 83.7% |
| Immigrants | Trinidad and Tobago | 0.2 /100 | #253 | Tragic 83.7% |
| Spaniards | 0.2 /100 | #254 | Tragic 83.7% |
| Haitians | 0.2 /100 | #255 | Tragic 83.7% |
| Immigrants | Haiti | 0.2 /100 | #256 | Tragic 83.7% |
| Delaware | 0.2 /100 | #257 | Tragic 83.7% |
| Immigrants | Guatemala | 0.1 /100 | #258 | Tragic 83.6% |
| Spanish | 0.1 /100 | #259 | Tragic 83.6% |
| Immigrants | Bahamas | 0.1 /100 | #260 | Tragic 83.6% |
| Pennsylvania Germans | 0.1 /100 | #261 | Tragic 83.6% |
| Immigrants | Fiji | 0.1 /100 | #262 | Tragic 83.6% |
| West Indians | 0.1 /100 | #263 | Tragic 83.5% |
Demographics Similar to Armenians by In Labor Force | Age 25-29
In terms of in labor force | age 25-29, the demographic groups most similar to Armenians are Immigrants from Eastern Asia (84.8%, a difference of 0.0%), Immigrants from Canada (84.8%, a difference of 0.010%), Immigrants from North America (84.8%, a difference of 0.010%), Danish (84.8%, a difference of 0.010%), and Pakistani (84.8%, a difference of 0.020%).
| Demographics | Rating | Rank | In Labor Force | Age 25-29 |
| Iranians | 78.1 /100 | #131 | Good 84.8% |
| Romanians | 77.7 /100 | #132 | Good 84.8% |
| Asians | 77.7 /100 | #133 | Good 84.8% |
| Syrians | 76.5 /100 | #134 | Good 84.8% |
| Immigrants | Hungary | 76.4 /100 | #135 | Good 84.8% |
| Bhutanese | 76.0 /100 | #136 | Good 84.8% |
| Immigrants | Canada | 73.5 /100 | #137 | Good 84.8% |
| Armenians | 72.7 /100 | #138 | Good 84.8% |
| Immigrants | Eastern Asia | 72.6 /100 | #139 | Good 84.8% |
| Immigrants | North America | 72.1 /100 | #140 | Good 84.8% |
| Danes | 71.9 /100 | #141 | Good 84.8% |
| Pakistanis | 70.0 /100 | #142 | Good 84.8% |
| Sri Lankans | 69.2 /100 | #143 | Good 84.8% |
| Immigrants | Laos | 69.0 /100 | #144 | Good 84.8% |
| Immigrants | Senegal | 68.3 /100 | #145 | Good 84.8% |