Immigrants from El Salvador vs Pakistani In Labor Force | Age 30-34
COMPARE
Immigrants from El Salvador
Pakistani
In Labor Force | Age 30-34
In Labor Force | Age 30-34 Comparison
Immigrants from El Salvador
Pakistanis
84.2%
IN LABOR FORCE | AGE 30-34
3.0/ 100
METRIC RATING
226th/ 347
METRIC RANK
84.7%
IN LABOR FORCE | AGE 30-34
60.8/ 100
METRIC RATING
160th/ 347
METRIC RANK
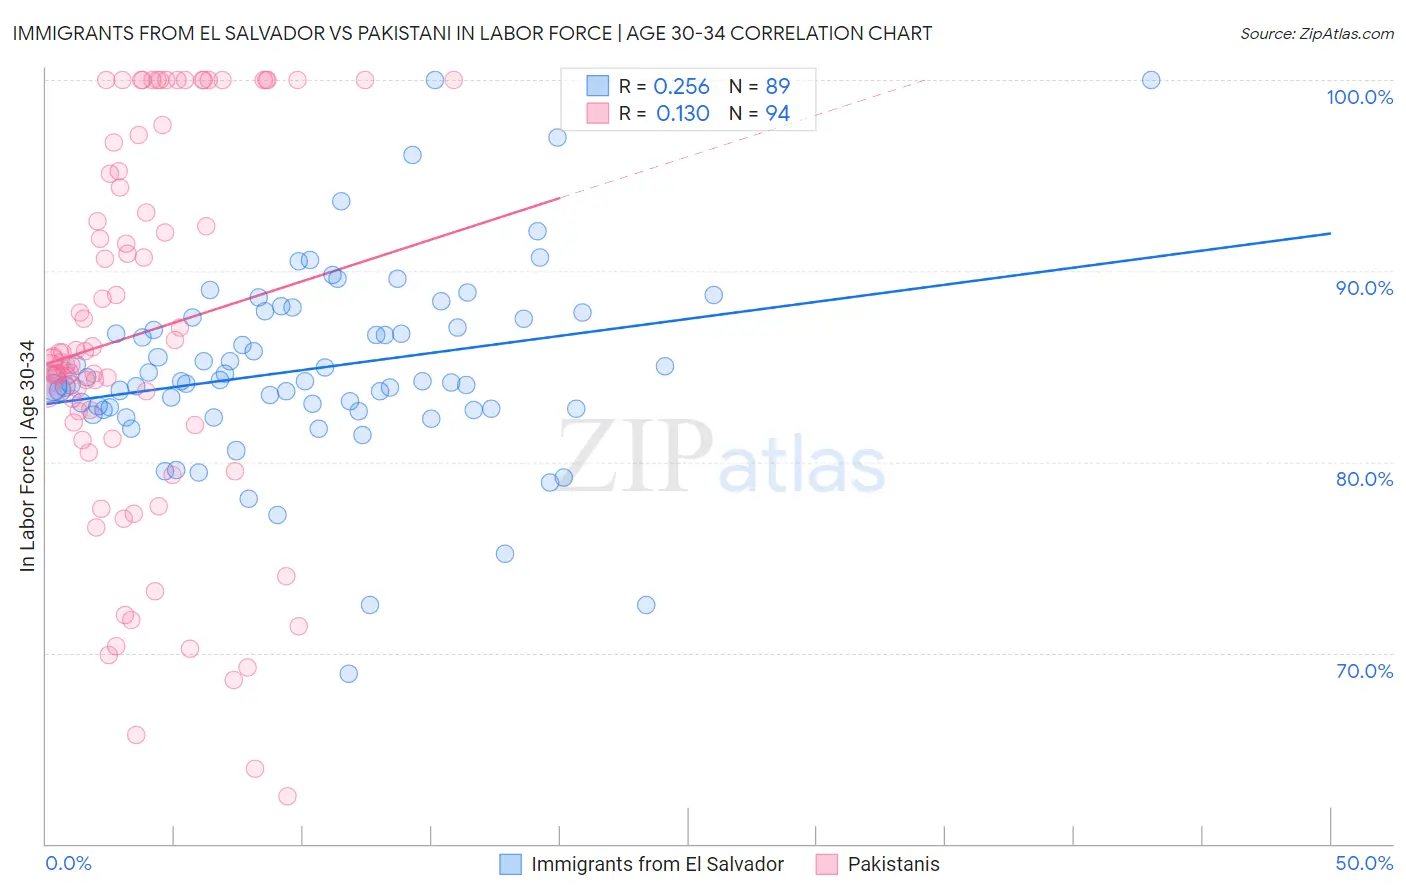
Immigrants from El Salvador vs Pakistani In Labor Force | Age 30-34 Correlation Chart
The statistical analysis conducted on geographies consisting of 357,707,534 people shows a weak positive correlation between the proportion of Immigrants from El Salvador and labor force participation rate among population between the ages 30 and 34 in the United States with a correlation coefficient (R) of 0.256 and weighted average of 84.2%. Similarly, the statistical analysis conducted on geographies consisting of 335,227,796 people shows a poor positive correlation between the proportion of Pakistanis and labor force participation rate among population between the ages 30 and 34 in the United States with a correlation coefficient (R) of 0.130 and weighted average of 84.7%, a difference of 0.69%.
In Labor Force | Age 30-34 Correlation Summary
| Measurement | Immigrants from El Salvador | Pakistani |
| Minimum | 68.9% | 62.5% |
| Maximum | 100.0% | 100.0% |
| Range | 31.1% | 37.5% |
| Mean | 84.9% | 86.7% |
| Median | 84.2% | 85.4% |
| Interquartile 25% (IQ1) | 82.8% | 81.9% |
| Interquartile 75% (IQ3) | 87.5% | 95.2% |
| Interquartile Range (IQR) | 4.8% | 13.3% |
| Standard Deviation (Sample) | 5.0% | 9.9% |
| Standard Deviation (Population) | 5.0% | 9.9% |
Similar Demographics by In Labor Force | Age 30-34
Demographics Similar to Immigrants from El Salvador by In Labor Force | Age 30-34
In terms of in labor force | age 30-34, the demographic groups most similar to Immigrants from El Salvador are Scottish (84.2%, a difference of 0.0%), Immigrants from Cuba (84.2%, a difference of 0.0%), Immigrants from Haiti (84.2%, a difference of 0.010%), Cuban (84.2%, a difference of 0.020%), and Welsh (84.2%, a difference of 0.020%).
| Demographics | Rating | Rank | In Labor Force | Age 30-34 |
| Swiss | 5.8 /100 | #219 | Tragic 84.3% |
| Danes | 5.3 /100 | #220 | Tragic 84.3% |
| Salvadorans | 3.8 /100 | #221 | Tragic 84.2% |
| Panamanians | 3.8 /100 | #222 | Tragic 84.2% |
| Immigrants | Laos | 3.6 /100 | #223 | Tragic 84.2% |
| Cubans | 3.4 /100 | #224 | Tragic 84.2% |
| Scottish | 3.1 /100 | #225 | Tragic 84.2% |
| Immigrants | El Salvador | 3.0 /100 | #226 | Tragic 84.2% |
| Immigrants | Cuba | 3.0 /100 | #227 | Tragic 84.2% |
| Immigrants | Haiti | 2.8 /100 | #228 | Tragic 84.2% |
| Welsh | 2.7 /100 | #229 | Tragic 84.2% |
| Immigrants | Bahamas | 2.6 /100 | #230 | Tragic 84.1% |
| Malaysians | 2.2 /100 | #231 | Tragic 84.1% |
| Immigrants | Immigrants | 2.0 /100 | #232 | Tragic 84.1% |
| West Indians | 1.9 /100 | #233 | Tragic 84.1% |
Demographics Similar to Pakistanis by In Labor Force | Age 30-34
In terms of in labor force | age 30-34, the demographic groups most similar to Pakistanis are Immigrants from Cambodia (84.7%, a difference of 0.0%), Czechoslovakian (84.8%, a difference of 0.020%), South American (84.7%, a difference of 0.020%), Immigrants from Uruguay (84.7%, a difference of 0.020%), and Immigrants from Armenia (84.8%, a difference of 0.030%).
| Demographics | Rating | Rank | In Labor Force | Age 30-34 |
| Syrians | 70.1 /100 | #153 | Good 84.8% |
| Northern Europeans | 70.0 /100 | #154 | Good 84.8% |
| Immigrants | Sudan | 69.5 /100 | #155 | Good 84.8% |
| French Canadians | 67.3 /100 | #156 | Good 84.8% |
| Peruvians | 65.9 /100 | #157 | Good 84.8% |
| Immigrants | Armenia | 64.7 /100 | #158 | Good 84.8% |
| Czechoslovakians | 63.0 /100 | #159 | Good 84.8% |
| Pakistanis | 60.8 /100 | #160 | Good 84.7% |
| Immigrants | Cambodia | 60.7 /100 | #161 | Good 84.7% |
| South Americans | 58.7 /100 | #162 | Average 84.7% |
| Immigrants | Uruguay | 57.4 /100 | #163 | Average 84.7% |
| Icelanders | 56.8 /100 | #164 | Average 84.7% |
| Immigrants | Western Europe | 56.7 /100 | #165 | Average 84.7% |
| Afghans | 55.2 /100 | #166 | Average 84.7% |
| Immigrants | South Eastern Asia | 54.2 /100 | #167 | Average 84.7% |