Immigrants from Chile vs Immigrants from Honduras In Labor Force | Age 30-34
COMPARE
Immigrants from Chile
Immigrants from Honduras
In Labor Force | Age 30-34
In Labor Force | Age 30-34 Comparison
Immigrants from Chile
Immigrants from Honduras
85.0%
IN LABOR FORCE | AGE 30-34
89.2/ 100
METRIC RATING
134th/ 347
METRIC RANK
83.7%
IN LABOR FORCE | AGE 30-34
0.1/ 100
METRIC RATING
265th/ 347
METRIC RANK
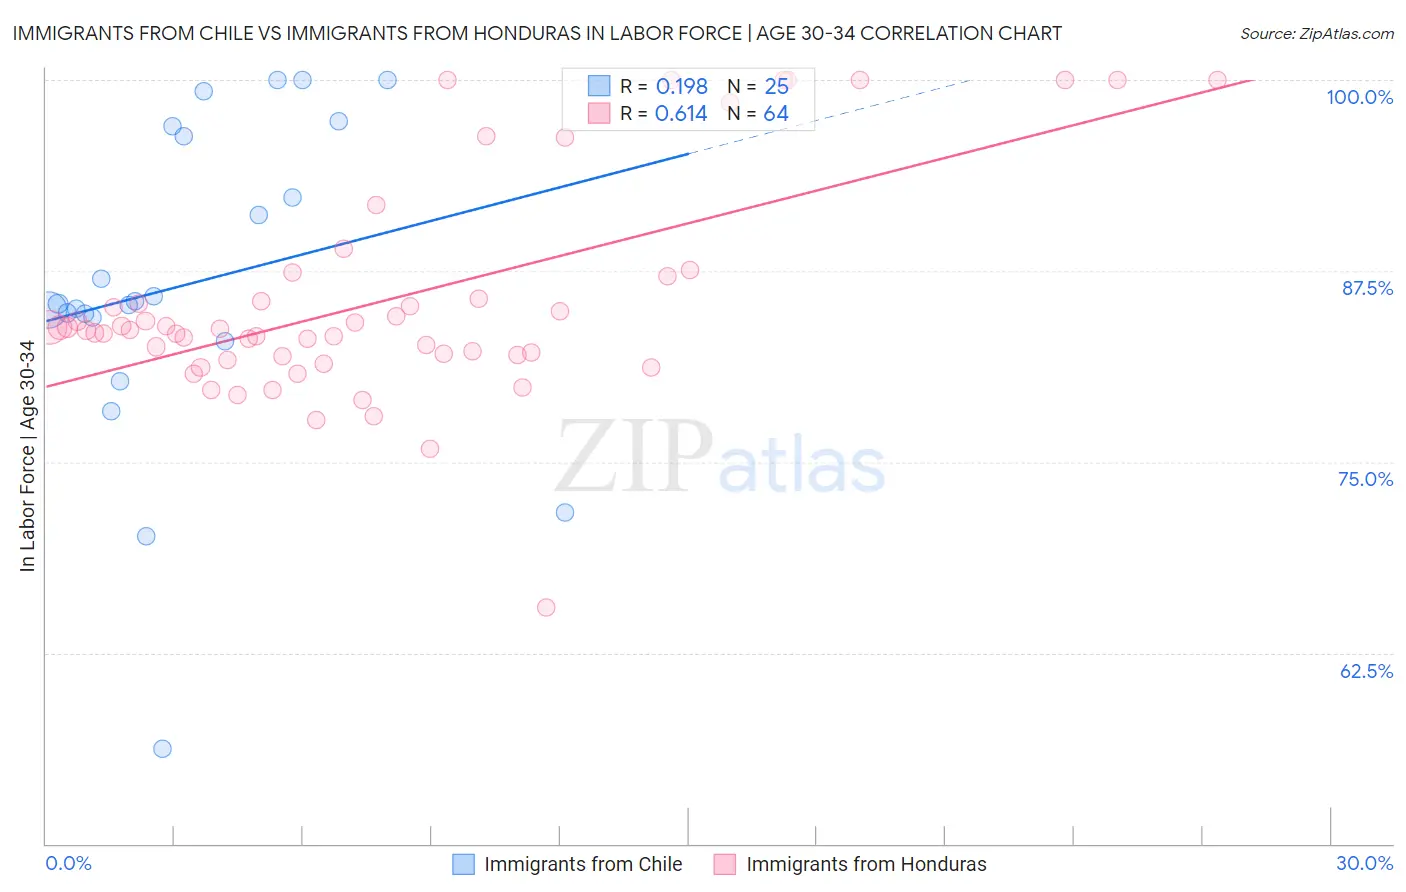
Immigrants from Chile vs Immigrants from Honduras In Labor Force | Age 30-34 Correlation Chart
The statistical analysis conducted on geographies consisting of 218,612,214 people shows a poor positive correlation between the proportion of Immigrants from Chile and labor force participation rate among population between the ages 30 and 34 in the United States with a correlation coefficient (R) of 0.198 and weighted average of 85.0%. Similarly, the statistical analysis conducted on geographies consisting of 322,455,880 people shows a significant positive correlation between the proportion of Immigrants from Honduras and labor force participation rate among population between the ages 30 and 34 in the United States with a correlation coefficient (R) of 0.614 and weighted average of 83.7%, a difference of 1.5%.
In Labor Force | Age 30-34 Correlation Summary
| Measurement | Immigrants from Chile | Immigrants from Honduras |
| Minimum | 56.2% | 65.5% |
| Maximum | 100.0% | 100.0% |
| Range | 43.8% | 34.5% |
| Mean | 86.6% | 85.6% |
| Median | 85.3% | 83.7% |
| Interquartile 25% (IQ1) | 83.7% | 81.9% |
| Interquartile 75% (IQ3) | 96.6% | 86.4% |
| Interquartile Range (IQR) | 13.0% | 4.5% |
| Standard Deviation (Sample) | 10.5% | 7.1% |
| Standard Deviation (Population) | 10.3% | 7.1% |
Similar Demographics by In Labor Force | Age 30-34
Demographics Similar to Immigrants from Chile by In Labor Force | Age 30-34
In terms of in labor force | age 30-34, the demographic groups most similar to Immigrants from Chile are Immigrants from Asia (85.0%, a difference of 0.0%), Chinese (85.0%, a difference of 0.010%), Immigrants from Israel (85.0%, a difference of 0.010%), New Zealander (85.0%, a difference of 0.010%), and Jordanian (85.0%, a difference of 0.010%).
| Demographics | Rating | Rank | In Labor Force | Age 30-34 |
| Slavs | 90.7 /100 | #127 | Exceptional 85.0% |
| Immigrants | Argentina | 90.6 /100 | #128 | Exceptional 85.0% |
| Immigrants | Western Africa | 90.2 /100 | #129 | Exceptional 85.0% |
| Immigrants | Spain | 90.0 /100 | #130 | Exceptional 85.0% |
| Chinese | 89.6 /100 | #131 | Excellent 85.0% |
| Immigrants | Israel | 89.5 /100 | #132 | Excellent 85.0% |
| New Zealanders | 89.5 /100 | #133 | Excellent 85.0% |
| Immigrants | Chile | 89.2 /100 | #134 | Excellent 85.0% |
| Immigrants | Asia | 88.9 /100 | #135 | Excellent 85.0% |
| Jordanians | 88.6 /100 | #136 | Excellent 85.0% |
| South Africans | 88.0 /100 | #137 | Excellent 85.0% |
| Sri Lankans | 87.8 /100 | #138 | Excellent 85.0% |
| Bhutanese | 87.5 /100 | #139 | Excellent 85.0% |
| Immigrants | Vietnam | 86.5 /100 | #140 | Excellent 85.0% |
| Chileans | 85.3 /100 | #141 | Excellent 84.9% |
Demographics Similar to Immigrants from Honduras by In Labor Force | Age 30-34
In terms of in labor force | age 30-34, the demographic groups most similar to Immigrants from Honduras are Immigrants from Guatemala (83.7%, a difference of 0.020%), Guatemalan (83.7%, a difference of 0.030%), Dominican (83.8%, a difference of 0.080%), Immigrants from Guyana (83.8%, a difference of 0.080%), and Guyanese (83.8%, a difference of 0.10%).
| Demographics | Rating | Rank | In Labor Force | Age 30-34 |
| Hondurans | 0.3 /100 | #258 | Tragic 83.8% |
| Scotch-Irish | 0.3 /100 | #259 | Tragic 83.8% |
| Immigrants | Dominican Republic | 0.3 /100 | #260 | Tragic 83.8% |
| Guyanese | 0.3 /100 | #261 | Tragic 83.8% |
| Dominicans | 0.2 /100 | #262 | Tragic 83.8% |
| Immigrants | Guyana | 0.2 /100 | #263 | Tragic 83.8% |
| Guatemalans | 0.2 /100 | #264 | Tragic 83.7% |
| Immigrants | Honduras | 0.1 /100 | #265 | Tragic 83.7% |
| Immigrants | Guatemala | 0.1 /100 | #266 | Tragic 83.7% |
| Spaniards | 0.1 /100 | #267 | Tragic 83.6% |
| Immigrants | Bangladesh | 0.1 /100 | #268 | Tragic 83.6% |
| Vietnamese | 0.1 /100 | #269 | Tragic 83.6% |
| Spanish Americans | 0.0 /100 | #270 | Tragic 83.5% |
| Spanish | 0.0 /100 | #271 | Tragic 83.5% |
| Immigrants | Nonimmigrants | 0.0 /100 | #272 | Tragic 83.5% |