Immigrants from Caribbean vs Delaware In Labor Force | Age 20-24
COMPARE
Immigrants from Caribbean
Delaware
In Labor Force | Age 20-24
In Labor Force | Age 20-24 Comparison
Immigrants from Caribbean
Delaware
71.9%
IN LABOR FORCE | AGE 20-24
0.0/ 100
METRIC RATING
312th/ 347
METRIC RANK
75.5%
IN LABOR FORCE | AGE 20-24
84.5/ 100
METRIC RATING
140th/ 347
METRIC RANK
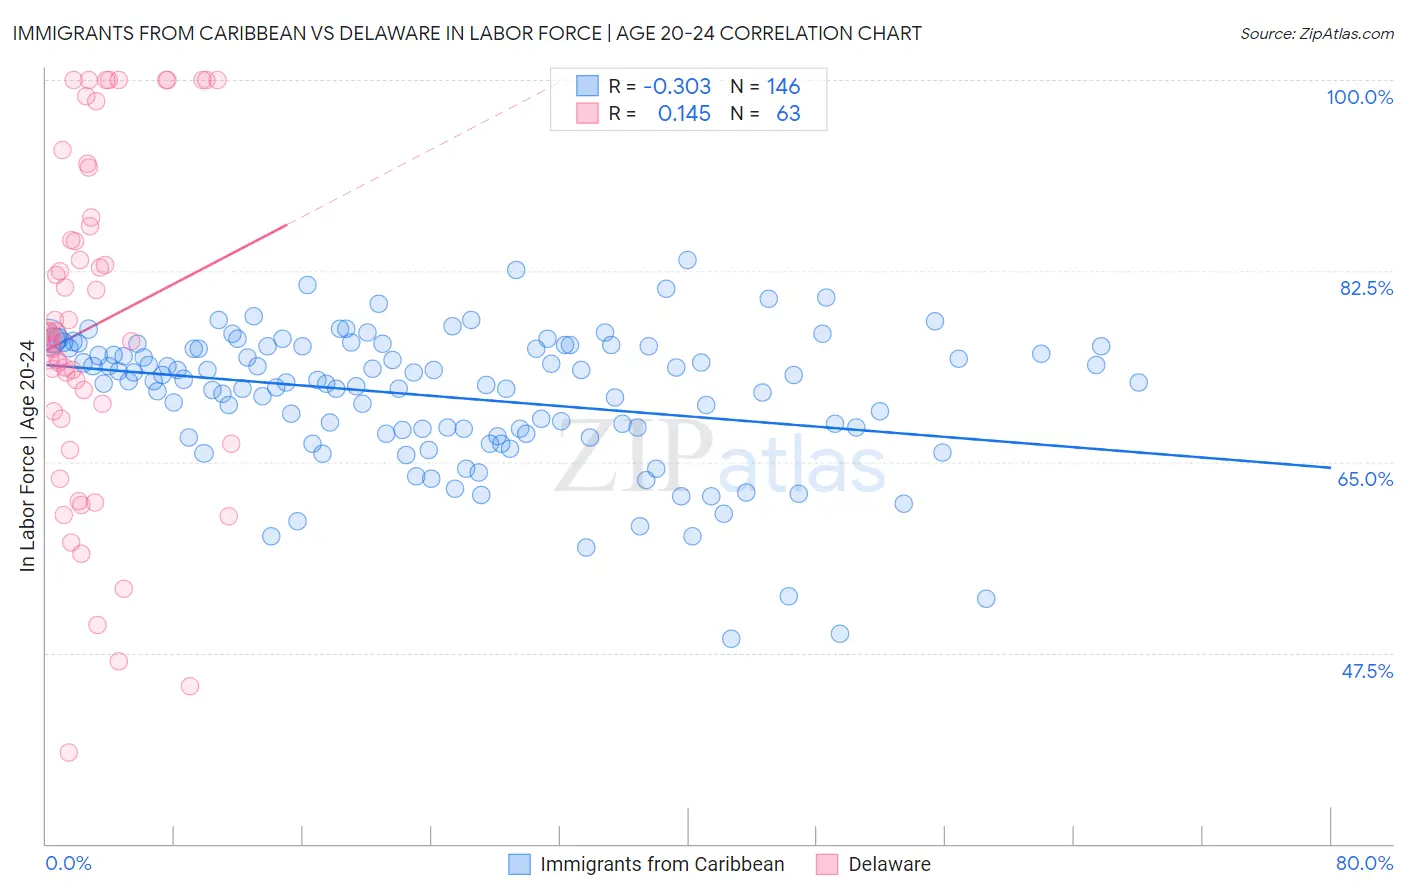
Immigrants from Caribbean vs Delaware In Labor Force | Age 20-24 Correlation Chart
The statistical analysis conducted on geographies consisting of 449,795,737 people shows a mild negative correlation between the proportion of Immigrants from Caribbean and labor force participation rate among population between the ages 20 and 24 in the United States with a correlation coefficient (R) of -0.303 and weighted average of 71.9%. Similarly, the statistical analysis conducted on geographies consisting of 96,225,060 people shows a poor positive correlation between the proportion of Delaware and labor force participation rate among population between the ages 20 and 24 in the United States with a correlation coefficient (R) of 0.145 and weighted average of 75.5%, a difference of 5.0%.
In Labor Force | Age 20-24 Correlation Summary
| Measurement | Immigrants from Caribbean | Delaware |
| Minimum | 48.8% | 38.4% |
| Maximum | 83.5% | 100.0% |
| Range | 34.7% | 61.6% |
| Mean | 71.0% | 77.4% |
| Median | 72.4% | 76.4% |
| Interquartile 25% (IQ1) | 67.6% | 69.0% |
| Interquartile 75% (IQ3) | 75.6% | 87.4% |
| Interquartile Range (IQR) | 8.0% | 18.4% |
| Standard Deviation (Sample) | 6.3% | 15.6% |
| Standard Deviation (Population) | 6.3% | 15.4% |
Similar Demographics by In Labor Force | Age 20-24
Demographics Similar to Immigrants from Caribbean by In Labor Force | Age 20-24
In terms of in labor force | age 20-24, the demographic groups most similar to Immigrants from Caribbean are Immigrants from Dominica (71.9%, a difference of 0.050%), Indian (Asian) (71.9%, a difference of 0.060%), Apache (72.0%, a difference of 0.070%), Immigrants from Cuba (72.0%, a difference of 0.080%), and Immigrants from Iran (71.8%, a difference of 0.14%).
| Demographics | Rating | Rank | In Labor Force | Age 20-24 |
| Immigrants | Singapore | 0.0 /100 | #305 | Tragic 72.4% |
| Immigrants | Jamaica | 0.0 /100 | #306 | Tragic 72.4% |
| Immigrants | Ecuador | 0.0 /100 | #307 | Tragic 72.3% |
| Soviet Union | 0.0 /100 | #308 | Tragic 72.3% |
| Tsimshian | 0.0 /100 | #309 | Tragic 72.3% |
| Immigrants | Cuba | 0.0 /100 | #310 | Tragic 72.0% |
| Apache | 0.0 /100 | #311 | Tragic 72.0% |
| Immigrants | Caribbean | 0.0 /100 | #312 | Tragic 71.9% |
| Immigrants | Dominica | 0.0 /100 | #313 | Tragic 71.9% |
| Indians (Asian) | 0.0 /100 | #314 | Tragic 71.9% |
| Immigrants | Iran | 0.0 /100 | #315 | Tragic 71.8% |
| Immigrants | Eastern Asia | 0.0 /100 | #316 | Tragic 71.8% |
| Immigrants | Armenia | 0.0 /100 | #317 | Tragic 71.7% |
| Immigrants | Hong Kong | 0.0 /100 | #318 | Tragic 71.6% |
| Immigrants | Israel | 0.0 /100 | #319 | Tragic 71.6% |
Demographics Similar to Delaware by In Labor Force | Age 20-24
In terms of in labor force | age 20-24, the demographic groups most similar to Delaware are Immigrants from England (75.5%, a difference of 0.0%), Immigrants from Brazil (75.5%, a difference of 0.010%), Jordanian (75.5%, a difference of 0.010%), Australian (75.5%, a difference of 0.010%), and Romanian (75.5%, a difference of 0.010%).
| Demographics | Rating | Rank | In Labor Force | Age 20-24 |
| Zimbabweans | 88.2 /100 | #133 | Excellent 75.6% |
| Estonians | 87.1 /100 | #134 | Excellent 75.6% |
| Yaqui | 85.5 /100 | #135 | Excellent 75.5% |
| Immigrants | Brazil | 84.8 /100 | #136 | Excellent 75.5% |
| Jordanians | 84.8 /100 | #137 | Excellent 75.5% |
| Australians | 84.8 /100 | #138 | Excellent 75.5% |
| Immigrants | England | 84.6 /100 | #139 | Excellent 75.5% |
| Delaware | 84.5 /100 | #140 | Excellent 75.5% |
| Romanians | 84.1 /100 | #141 | Excellent 75.5% |
| Blackfeet | 83.6 /100 | #142 | Excellent 75.5% |
| Spaniards | 82.0 /100 | #143 | Excellent 75.5% |
| Bhutanese | 80.8 /100 | #144 | Excellent 75.4% |
| Koreans | 79.7 /100 | #145 | Good 75.4% |
| Mexican American Indians | 78.8 /100 | #146 | Good 75.4% |
| Comanche | 77.6 /100 | #147 | Good 75.4% |