Immigrants from Canada vs Paraguayan In Labor Force | Age 25-29
COMPARE
Immigrants from Canada
Paraguayan
In Labor Force | Age 25-29
In Labor Force | Age 25-29 Comparison
Immigrants from Canada
Paraguayans
84.8%
IN LABOR FORCE | AGE 25-29
73.5/ 100
METRIC RATING
137th/ 347
METRIC RANK
85.9%
IN LABOR FORCE | AGE 25-29
100.0/ 100
METRIC RATING
27th/ 347
METRIC RANK
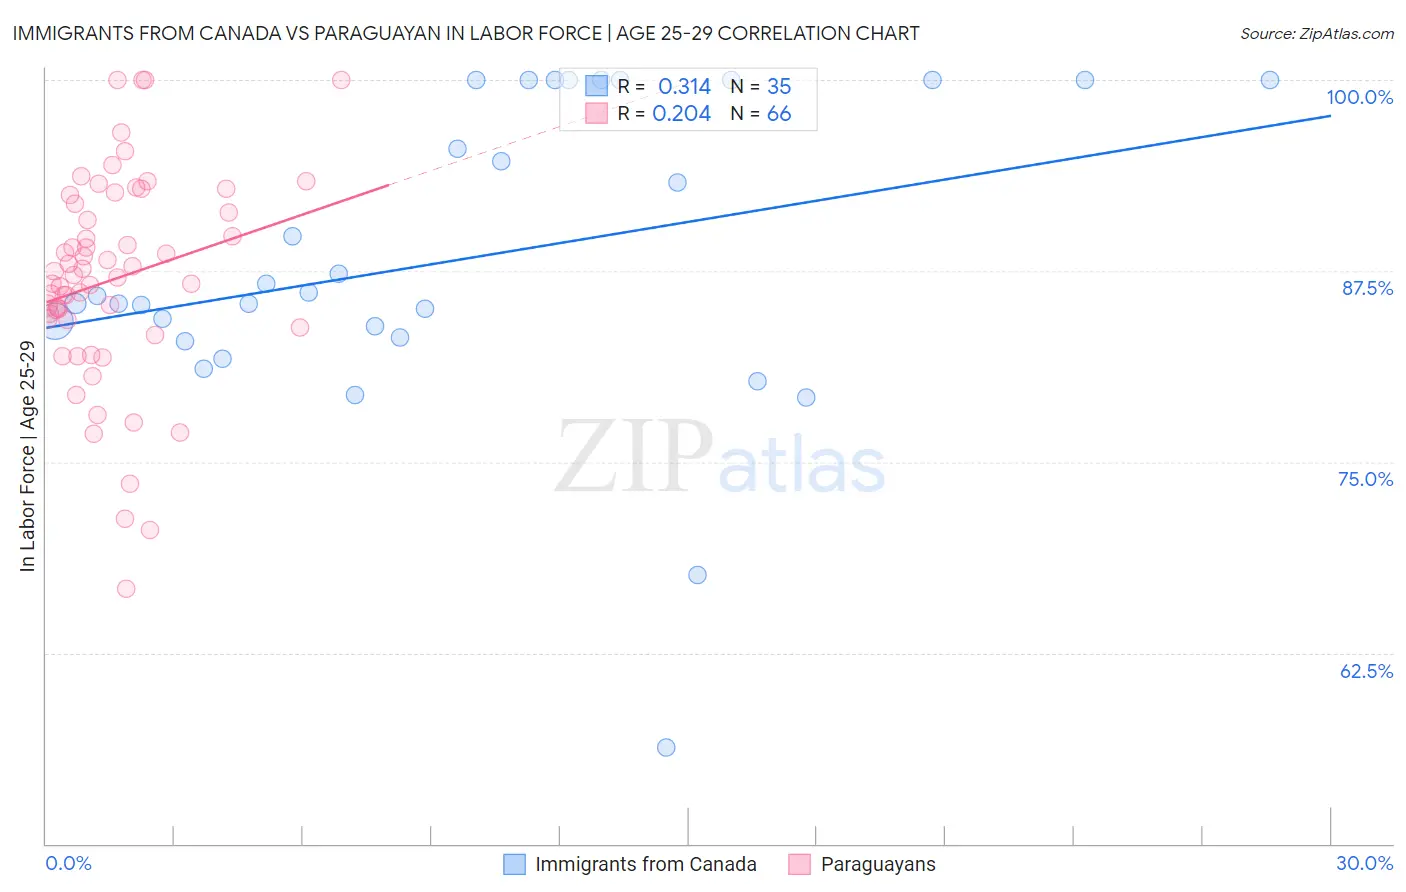
Immigrants from Canada vs Paraguayan In Labor Force | Age 25-29 Correlation Chart
The statistical analysis conducted on geographies consisting of 459,055,587 people shows a mild positive correlation between the proportion of Immigrants from Canada and labor force participation rate among population between the ages 25 and 29 in the United States with a correlation coefficient (R) of 0.314 and weighted average of 84.8%. Similarly, the statistical analysis conducted on geographies consisting of 95,105,019 people shows a weak positive correlation between the proportion of Paraguayans and labor force participation rate among population between the ages 25 and 29 in the United States with a correlation coefficient (R) of 0.204 and weighted average of 85.9%, a difference of 1.3%.
In Labor Force | Age 25-29 Correlation Summary
| Measurement | Immigrants from Canada | Paraguayan |
| Minimum | 56.3% | 66.7% |
| Maximum | 100.0% | 100.0% |
| Range | 43.7% | 33.3% |
| Mean | 88.3% | 87.0% |
| Median | 85.9% | 87.2% |
| Interquartile 25% (IQ1) | 83.2% | 84.3% |
| Interquartile 75% (IQ3) | 100.0% | 91.9% |
| Interquartile Range (IQR) | 16.8% | 7.6% |
| Standard Deviation (Sample) | 10.0% | 6.9% |
| Standard Deviation (Population) | 9.9% | 6.8% |
Similar Demographics by In Labor Force | Age 25-29
Demographics Similar to Immigrants from Canada by In Labor Force | Age 25-29
In terms of in labor force | age 25-29, the demographic groups most similar to Immigrants from Canada are Armenian (84.8%, a difference of 0.010%), Immigrants from Eastern Asia (84.8%, a difference of 0.010%), Immigrants from North America (84.8%, a difference of 0.010%), Bhutanese (84.8%, a difference of 0.020%), and Danish (84.8%, a difference of 0.020%).
| Demographics | Rating | Rank | In Labor Force | Age 25-29 |
| Northern Europeans | 81.3 /100 | #130 | Excellent 84.9% |
| Iranians | 78.1 /100 | #131 | Good 84.8% |
| Romanians | 77.7 /100 | #132 | Good 84.8% |
| Asians | 77.7 /100 | #133 | Good 84.8% |
| Syrians | 76.5 /100 | #134 | Good 84.8% |
| Immigrants | Hungary | 76.4 /100 | #135 | Good 84.8% |
| Bhutanese | 76.0 /100 | #136 | Good 84.8% |
| Immigrants | Canada | 73.5 /100 | #137 | Good 84.8% |
| Armenians | 72.7 /100 | #138 | Good 84.8% |
| Immigrants | Eastern Asia | 72.6 /100 | #139 | Good 84.8% |
| Immigrants | North America | 72.1 /100 | #140 | Good 84.8% |
| Danes | 71.9 /100 | #141 | Good 84.8% |
| Pakistanis | 70.0 /100 | #142 | Good 84.8% |
| Sri Lankans | 69.2 /100 | #143 | Good 84.8% |
| Immigrants | Laos | 69.0 /100 | #144 | Good 84.8% |
Demographics Similar to Paraguayans by In Labor Force | Age 25-29
In terms of in labor force | age 25-29, the demographic groups most similar to Paraguayans are Immigrants from North Macedonia (85.9%, a difference of 0.010%), Ugandan (85.9%, a difference of 0.010%), Immigrants from Liberia (85.9%, a difference of 0.010%), Immigrants from Serbia (85.9%, a difference of 0.050%), and German Russian (85.8%, a difference of 0.060%).
| Demographics | Rating | Rank | In Labor Force | Age 25-29 |
| Immigrants | Ireland | 100.0 /100 | #20 | Exceptional 86.0% |
| Maltese | 100.0 /100 | #21 | Exceptional 86.0% |
| Cambodians | 100.0 /100 | #22 | Exceptional 86.0% |
| Immigrants | Uganda | 100.0 /100 | #23 | Exceptional 86.0% |
| Immigrants | Eastern Africa | 100.0 /100 | #24 | Exceptional 86.0% |
| Sudanese | 100.0 /100 | #25 | Exceptional 85.9% |
| Immigrants | North Macedonia | 100.0 /100 | #26 | Exceptional 85.9% |
| Paraguayans | 100.0 /100 | #27 | Exceptional 85.9% |
| Ugandans | 100.0 /100 | #28 | Exceptional 85.9% |
| Immigrants | Liberia | 100.0 /100 | #29 | Exceptional 85.9% |
| Immigrants | Serbia | 100.0 /100 | #30 | Exceptional 85.9% |
| German Russians | 100.0 /100 | #31 | Exceptional 85.8% |
| Slovaks | 100.0 /100 | #32 | Exceptional 85.8% |
| Immigrants | Bulgaria | 100.0 /100 | #33 | Exceptional 85.8% |
| Lithuanians | 99.9 /100 | #34 | Exceptional 85.8% |