Immigrants from Canada vs Immigrants from Singapore In Labor Force | Age 25-29
COMPARE
Immigrants from Canada
Immigrants from Singapore
In Labor Force | Age 25-29
In Labor Force | Age 25-29 Comparison
Immigrants from Canada
Immigrants from Singapore
84.8%
IN LABOR FORCE | AGE 25-29
73.5/ 100
METRIC RATING
137th/ 347
METRIC RANK
84.9%
IN LABOR FORCE | AGE 25-29
84.4/ 100
METRIC RATING
126th/ 347
METRIC RANK
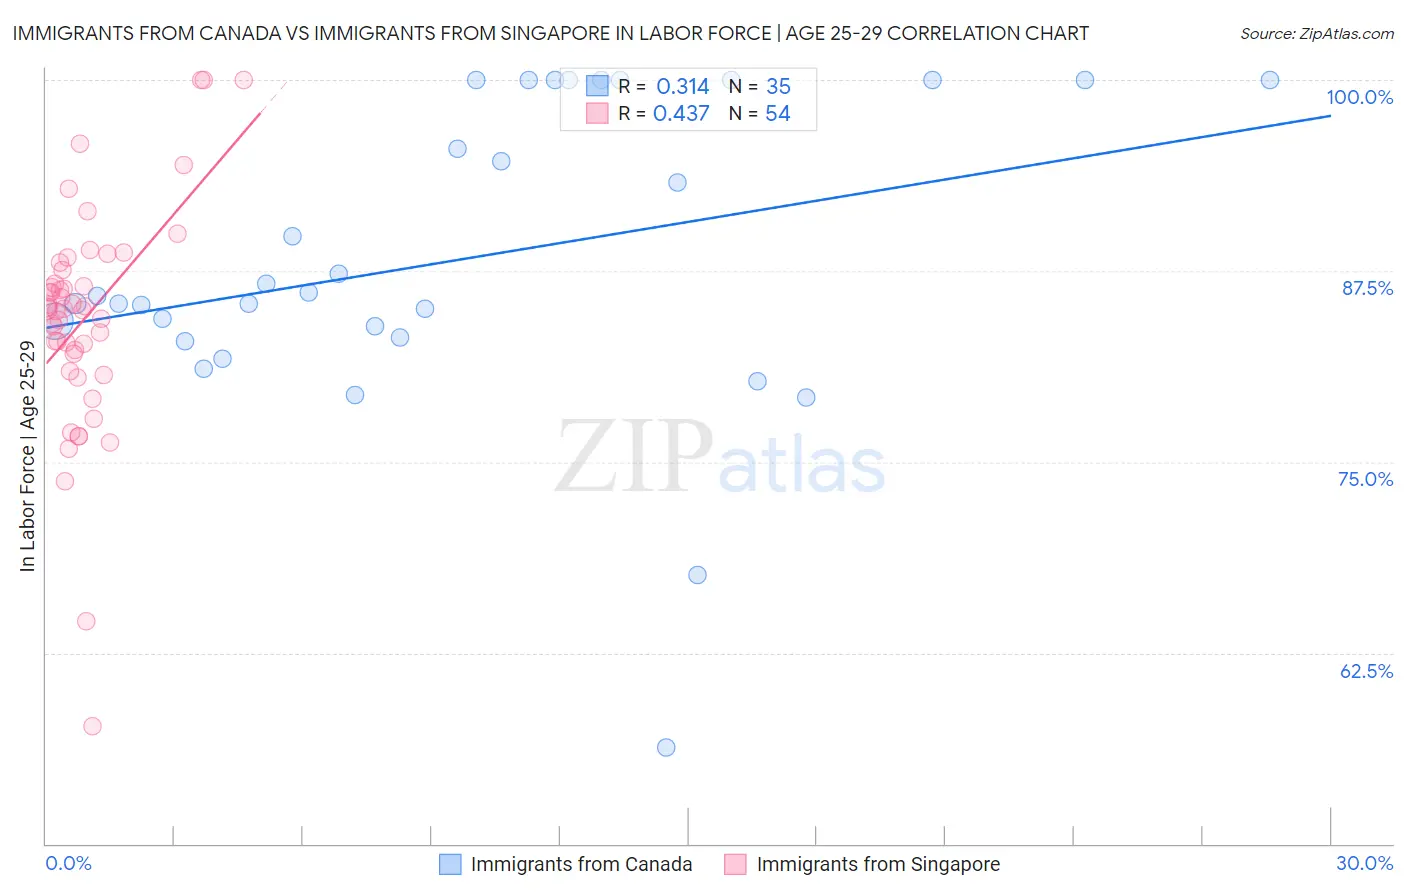
Immigrants from Canada vs Immigrants from Singapore In Labor Force | Age 25-29 Correlation Chart
The statistical analysis conducted on geographies consisting of 459,055,587 people shows a mild positive correlation between the proportion of Immigrants from Canada and labor force participation rate among population between the ages 25 and 29 in the United States with a correlation coefficient (R) of 0.314 and weighted average of 84.8%. Similarly, the statistical analysis conducted on geographies consisting of 137,510,169 people shows a moderate positive correlation between the proportion of Immigrants from Singapore and labor force participation rate among population between the ages 25 and 29 in the United States with a correlation coefficient (R) of 0.437 and weighted average of 84.9%, a difference of 0.12%.
In Labor Force | Age 25-29 Correlation Summary
| Measurement | Immigrants from Canada | Immigrants from Singapore |
| Minimum | 56.3% | 57.7% |
| Maximum | 100.0% | 100.0% |
| Range | 43.7% | 42.3% |
| Mean | 88.3% | 84.4% |
| Median | 85.9% | 85.0% |
| Interquartile 25% (IQ1) | 83.2% | 82.1% |
| Interquartile 75% (IQ3) | 100.0% | 87.6% |
| Interquartile Range (IQR) | 16.8% | 5.5% |
| Standard Deviation (Sample) | 10.0% | 7.4% |
| Standard Deviation (Population) | 9.9% | 7.3% |
Demographics Similar to Immigrants from Canada and Immigrants from Singapore by In Labor Force | Age 25-29
In terms of in labor force | age 25-29, the demographic groups most similar to Immigrants from Canada are Armenian (84.8%, a difference of 0.010%), Immigrants from Eastern Asia (84.8%, a difference of 0.010%), Immigrants from North America (84.8%, a difference of 0.010%), Bhutanese (84.8%, a difference of 0.020%), and Danish (84.8%, a difference of 0.020%). Similarly, the demographic groups most similar to Immigrants from Singapore are Uruguayan (84.9%, a difference of 0.0%), Scandinavian (84.9%, a difference of 0.010%), Dutch (84.9%, a difference of 0.010%), Immigrants from Iran (84.9%, a difference of 0.010%), and Immigrants from Uruguay (84.9%, a difference of 0.010%).
| Demographics | Rating | Rank | In Labor Force | Age 25-29 |
| Immigrants | Chile | 85.6 /100 | #121 | Excellent 84.9% |
| Scandinavians | 85.1 /100 | #122 | Excellent 84.9% |
| Dutch | 84.9 /100 | #123 | Excellent 84.9% |
| Immigrants | Iran | 84.8 /100 | #124 | Excellent 84.9% |
| Uruguayans | 84.7 /100 | #125 | Excellent 84.9% |
| Immigrants | Singapore | 84.4 /100 | #126 | Excellent 84.9% |
| Immigrants | Uruguay | 84.0 /100 | #127 | Excellent 84.9% |
| Australians | 83.6 /100 | #128 | Excellent 84.9% |
| Immigrants | Russia | 81.6 /100 | #129 | Excellent 84.9% |
| Northern Europeans | 81.3 /100 | #130 | Excellent 84.9% |
| Iranians | 78.1 /100 | #131 | Good 84.8% |
| Romanians | 77.7 /100 | #132 | Good 84.8% |
| Asians | 77.7 /100 | #133 | Good 84.8% |
| Syrians | 76.5 /100 | #134 | Good 84.8% |
| Immigrants | Hungary | 76.4 /100 | #135 | Good 84.8% |
| Bhutanese | 76.0 /100 | #136 | Good 84.8% |
| Immigrants | Canada | 73.5 /100 | #137 | Good 84.8% |
| Armenians | 72.7 /100 | #138 | Good 84.8% |
| Immigrants | Eastern Asia | 72.6 /100 | #139 | Good 84.8% |
| Immigrants | North America | 72.1 /100 | #140 | Good 84.8% |
| Danes | 71.9 /100 | #141 | Good 84.8% |