Immigrants from Australia vs Shoshone In Labor Force | Age 45-54
COMPARE
Immigrants from Australia
Shoshone
In Labor Force | Age 45-54
In Labor Force | Age 45-54 Comparison
Immigrants from Australia
Shoshone
82.9%
IN LABOR FORCE | AGE 45-54
68.2/ 100
METRIC RATING
157th/ 347
METRIC RANK
79.3%
IN LABOR FORCE | AGE 45-54
0.0/ 100
METRIC RATING
316th/ 347
METRIC RANK
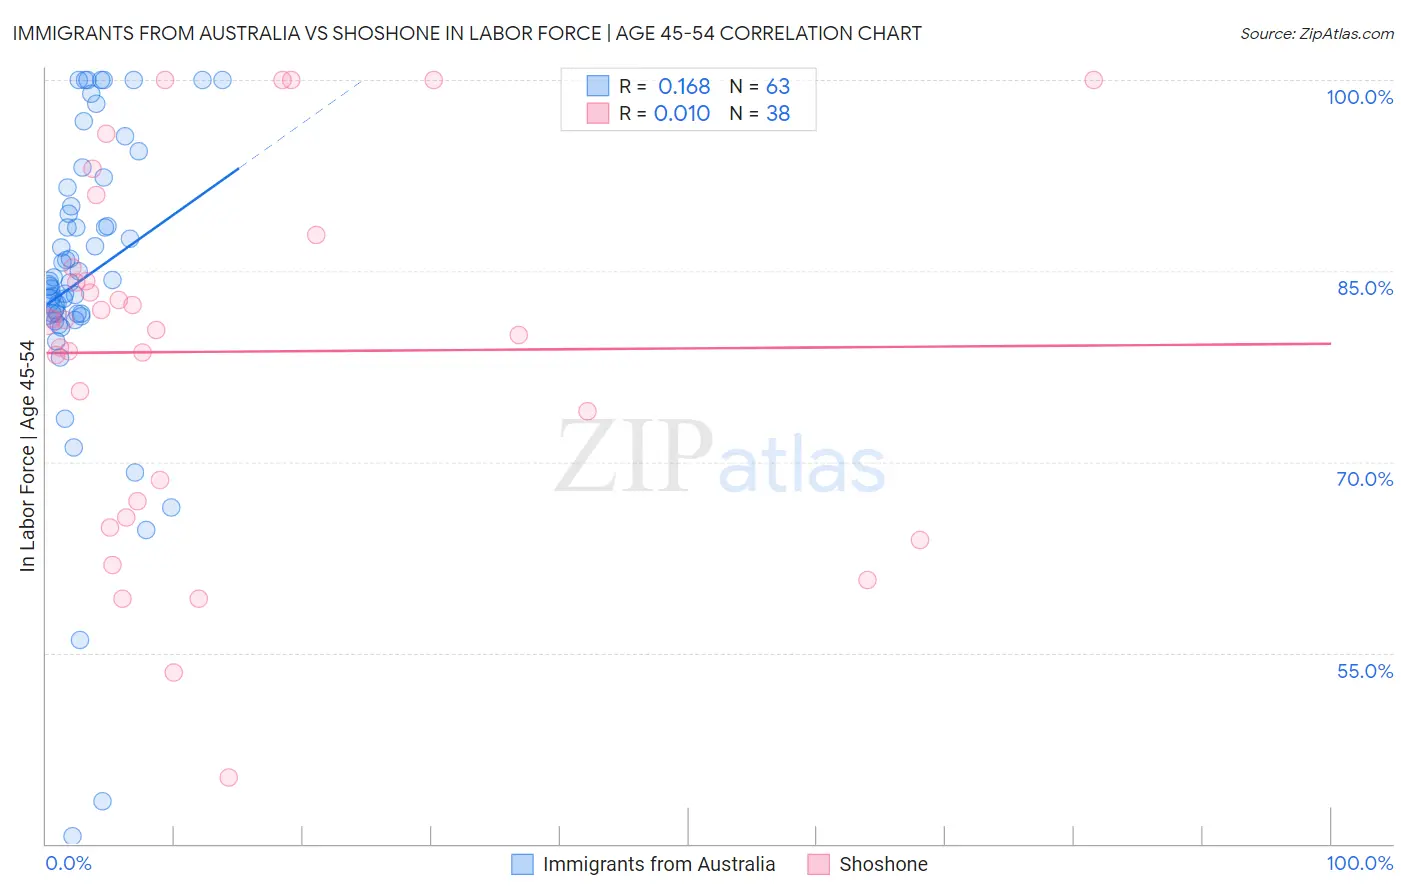
Immigrants from Australia vs Shoshone In Labor Force | Age 45-54 Correlation Chart
The statistical analysis conducted on geographies consisting of 227,126,379 people shows a poor positive correlation between the proportion of Immigrants from Australia and labor force participation rate among population between the ages 45 and 54 in the United States with a correlation coefficient (R) of 0.168 and weighted average of 82.9%. Similarly, the statistical analysis conducted on geographies consisting of 66,619,718 people shows no correlation between the proportion of Shoshone and labor force participation rate among population between the ages 45 and 54 in the United States with a correlation coefficient (R) of 0.010 and weighted average of 79.3%, a difference of 4.6%.
In Labor Force | Age 45-54 Correlation Summary
| Measurement | Immigrants from Australia | Shoshone |
| Minimum | 40.6% | 45.2% |
| Maximum | 100.0% | 100.0% |
| Range | 59.4% | 54.8% |
| Mean | 84.5% | 78.7% |
| Median | 84.2% | 80.7% |
| Interquartile 25% (IQ1) | 81.6% | 66.9% |
| Interquartile 75% (IQ3) | 91.5% | 85.3% |
| Interquartile Range (IQR) | 9.9% | 18.4% |
| Standard Deviation (Sample) | 12.0% | 13.9% |
| Standard Deviation (Population) | 11.9% | 13.7% |
Similar Demographics by In Labor Force | Age 45-54
Demographics Similar to Immigrants from Australia by In Labor Force | Age 45-54
In terms of in labor force | age 45-54, the demographic groups most similar to Immigrants from Australia are Immigrants from Southern Europe (82.9%, a difference of 0.0%), Immigrants from Philippines (82.9%, a difference of 0.010%), Immigrants from Saudi Arabia (82.9%, a difference of 0.010%), Immigrants from Indonesia (82.9%, a difference of 0.020%), and Immigrants from Ghana (82.9%, a difference of 0.020%).
| Demographics | Rating | Rank | In Labor Force | Age 45-54 |
| Immigrants | Netherlands | 72.6 /100 | #150 | Good 82.9% |
| Koreans | 71.9 /100 | #151 | Good 82.9% |
| Slavs | 71.5 /100 | #152 | Good 82.9% |
| Immigrants | Indonesia | 70.6 /100 | #153 | Good 82.9% |
| Immigrants | Ghana | 70.3 /100 | #154 | Good 82.9% |
| Immigrants | Philippines | 69.0 /100 | #155 | Good 82.9% |
| Immigrants | Saudi Arabia | 68.8 /100 | #156 | Good 82.9% |
| Immigrants | Australia | 68.2 /100 | #157 | Good 82.9% |
| Immigrants | Southern Europe | 67.8 /100 | #158 | Good 82.9% |
| Immigrants | Austria | 64.6 /100 | #159 | Good 82.9% |
| Laotians | 62.8 /100 | #160 | Good 82.9% |
| South American Indians | 62.2 /100 | #161 | Good 82.9% |
| Haitians | 61.8 /100 | #162 | Good 82.8% |
| Dutch | 61.7 /100 | #163 | Good 82.8% |
| German Russians | 61.3 /100 | #164 | Good 82.8% |
Demographics Similar to Shoshone by In Labor Force | Age 45-54
In terms of in labor force | age 45-54, the demographic groups most similar to Shoshone are Black/African American (79.3%, a difference of 0.080%), Comanche (79.2%, a difference of 0.13%), Ottawa (79.5%, a difference of 0.22%), Colville (79.5%, a difference of 0.26%), and Chickasaw (79.0%, a difference of 0.31%).
| Demographics | Rating | Rank | In Labor Force | Age 45-54 |
| Potawatomi | 0.0 /100 | #309 | Tragic 80.0% |
| Inupiat | 0.0 /100 | #310 | Tragic 79.9% |
| Mexicans | 0.0 /100 | #311 | Tragic 79.8% |
| Immigrants | Mexico | 0.0 /100 | #312 | Tragic 79.7% |
| Colville | 0.0 /100 | #313 | Tragic 79.5% |
| Ottawa | 0.0 /100 | #314 | Tragic 79.5% |
| Blacks/African Americans | 0.0 /100 | #315 | Tragic 79.3% |
| Shoshone | 0.0 /100 | #316 | Tragic 79.3% |
| Comanche | 0.0 /100 | #317 | Tragic 79.2% |
| Chickasaw | 0.0 /100 | #318 | Tragic 79.0% |
| Cherokee | 0.0 /100 | #319 | Tragic 79.0% |
| Yaqui | 0.0 /100 | #320 | Tragic 78.9% |
| Yup'ik | 0.0 /100 | #321 | Tragic 78.6% |
| Crow | 0.0 /100 | #322 | Tragic 78.3% |
| Kiowa | 0.0 /100 | #323 | Tragic 78.3% |