European vs Shoshone In Labor Force | Age 45-54
COMPARE
European
Shoshone
In Labor Force | Age 45-54
In Labor Force | Age 45-54 Comparison
Europeans
Shoshone
82.6%
IN LABOR FORCE | AGE 45-54
32.6/ 100
METRIC RATING
184th/ 347
METRIC RANK
79.3%
IN LABOR FORCE | AGE 45-54
0.0/ 100
METRIC RATING
316th/ 347
METRIC RANK
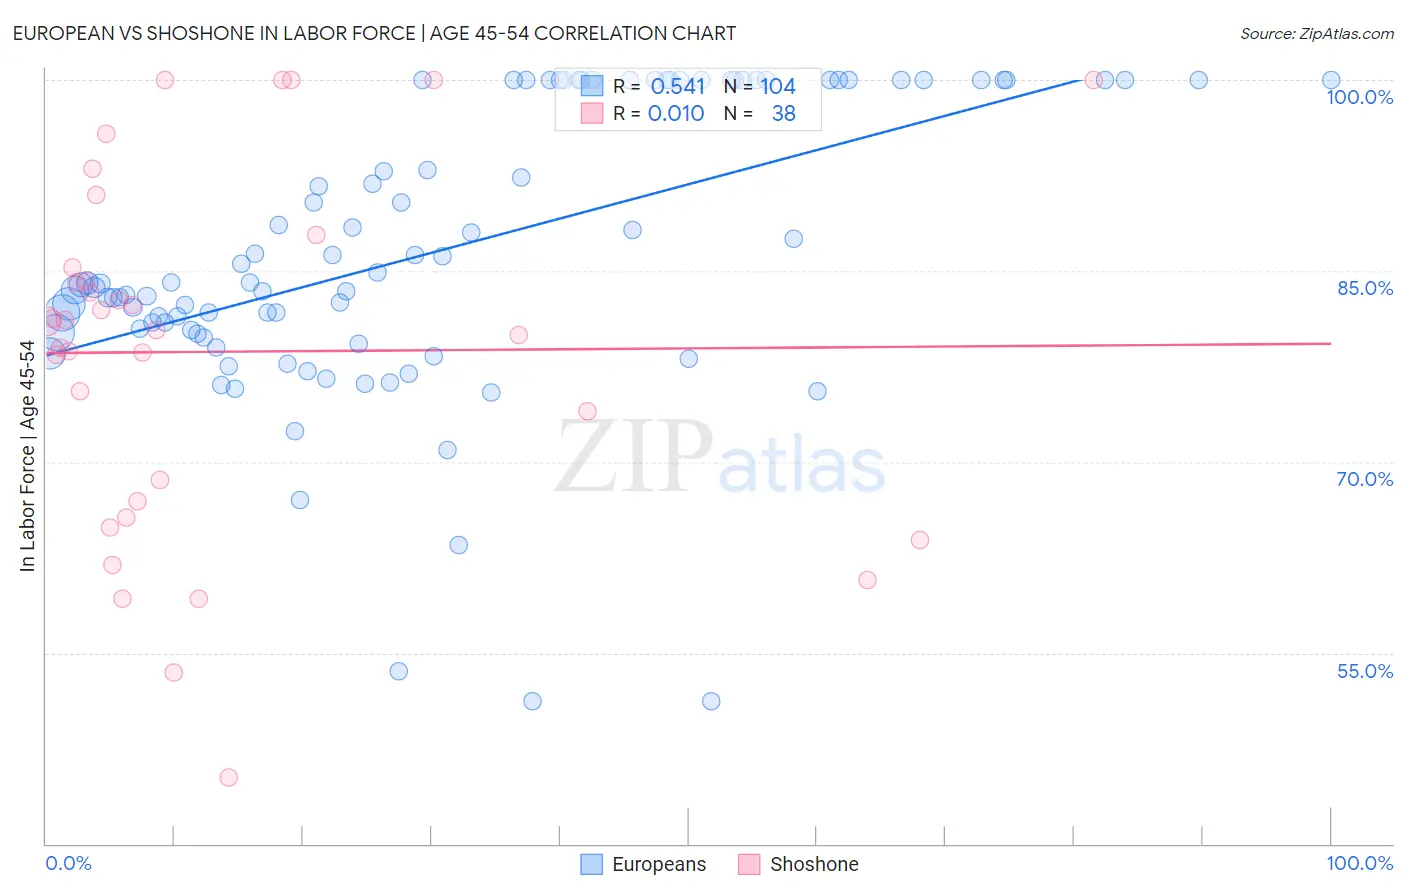
European vs Shoshone In Labor Force | Age 45-54 Correlation Chart
The statistical analysis conducted on geographies consisting of 561,134,108 people shows a substantial positive correlation between the proportion of Europeans and labor force participation rate among population between the ages 45 and 54 in the United States with a correlation coefficient (R) of 0.541 and weighted average of 82.6%. Similarly, the statistical analysis conducted on geographies consisting of 66,619,718 people shows no correlation between the proportion of Shoshone and labor force participation rate among population between the ages 45 and 54 in the United States with a correlation coefficient (R) of 0.010 and weighted average of 79.3%, a difference of 4.2%.
In Labor Force | Age 45-54 Correlation Summary
| Measurement | European | Shoshone |
| Minimum | 51.2% | 45.2% |
| Maximum | 100.0% | 100.0% |
| Range | 48.8% | 54.8% |
| Mean | 86.7% | 78.7% |
| Median | 84.1% | 80.7% |
| Interquartile 25% (IQ1) | 80.3% | 66.9% |
| Interquartile 75% (IQ3) | 100.0% | 85.3% |
| Interquartile Range (IQR) | 19.7% | 18.4% |
| Standard Deviation (Sample) | 11.2% | 13.9% |
| Standard Deviation (Population) | 11.2% | 13.7% |
Similar Demographics by In Labor Force | Age 45-54
Demographics Similar to Europeans by In Labor Force | Age 45-54
In terms of in labor force | age 45-54, the demographic groups most similar to Europeans are New Zealander (82.6%, a difference of 0.0%), Immigrants from England (82.6%, a difference of 0.0%), Immigrants from Hungary (82.7%, a difference of 0.040%), Irish (82.6%, a difference of 0.040%), and Hungarian (82.7%, a difference of 0.050%).
| Demographics | Rating | Rank | In Labor Force | Age 45-54 |
| Immigrants | Nicaragua | 44.6 /100 | #177 | Average 82.7% |
| Nigerians | 40.5 /100 | #178 | Average 82.7% |
| Immigrants | Switzerland | 39.4 /100 | #179 | Fair 82.7% |
| Hungarians | 38.0 /100 | #180 | Fair 82.7% |
| Israelis | 37.7 /100 | #181 | Fair 82.7% |
| Immigrants | Hungary | 37.1 /100 | #182 | Fair 82.7% |
| New Zealanders | 32.7 /100 | #183 | Fair 82.6% |
| Europeans | 32.6 /100 | #184 | Fair 82.6% |
| Immigrants | England | 32.2 /100 | #185 | Fair 82.6% |
| Irish | 29.2 /100 | #186 | Fair 82.6% |
| Immigrants | Costa Rica | 28.3 /100 | #187 | Fair 82.6% |
| South Africans | 28.0 /100 | #188 | Fair 82.6% |
| Syrians | 26.0 /100 | #189 | Fair 82.6% |
| British | 25.7 /100 | #190 | Fair 82.6% |
| Armenians | 23.2 /100 | #191 | Fair 82.5% |
Demographics Similar to Shoshone by In Labor Force | Age 45-54
In terms of in labor force | age 45-54, the demographic groups most similar to Shoshone are Black/African American (79.3%, a difference of 0.080%), Comanche (79.2%, a difference of 0.13%), Ottawa (79.5%, a difference of 0.22%), Colville (79.5%, a difference of 0.26%), and Chickasaw (79.0%, a difference of 0.31%).
| Demographics | Rating | Rank | In Labor Force | Age 45-54 |
| Potawatomi | 0.0 /100 | #309 | Tragic 80.0% |
| Inupiat | 0.0 /100 | #310 | Tragic 79.9% |
| Mexicans | 0.0 /100 | #311 | Tragic 79.8% |
| Immigrants | Mexico | 0.0 /100 | #312 | Tragic 79.7% |
| Colville | 0.0 /100 | #313 | Tragic 79.5% |
| Ottawa | 0.0 /100 | #314 | Tragic 79.5% |
| Blacks/African Americans | 0.0 /100 | #315 | Tragic 79.3% |
| Shoshone | 0.0 /100 | #316 | Tragic 79.3% |
| Comanche | 0.0 /100 | #317 | Tragic 79.2% |
| Chickasaw | 0.0 /100 | #318 | Tragic 79.0% |
| Cherokee | 0.0 /100 | #319 | Tragic 79.0% |
| Yaqui | 0.0 /100 | #320 | Tragic 78.9% |
| Yup'ik | 0.0 /100 | #321 | Tragic 78.6% |
| Crow | 0.0 /100 | #322 | Tragic 78.3% |
| Kiowa | 0.0 /100 | #323 | Tragic 78.3% |