Immigrants from Argentina vs Iraqi In Labor Force | Age 35-44
COMPARE
Immigrants from Argentina
Iraqi
In Labor Force | Age 35-44
In Labor Force | Age 35-44 Comparison
Immigrants from Argentina
Iraqis
84.8%
IN LABOR FORCE | AGE 35-44
94.5/ 100
METRIC RATING
108th/ 347
METRIC RANK
83.8%
IN LABOR FORCE | AGE 35-44
1.3/ 100
METRIC RATING
241st/ 347
METRIC RANK
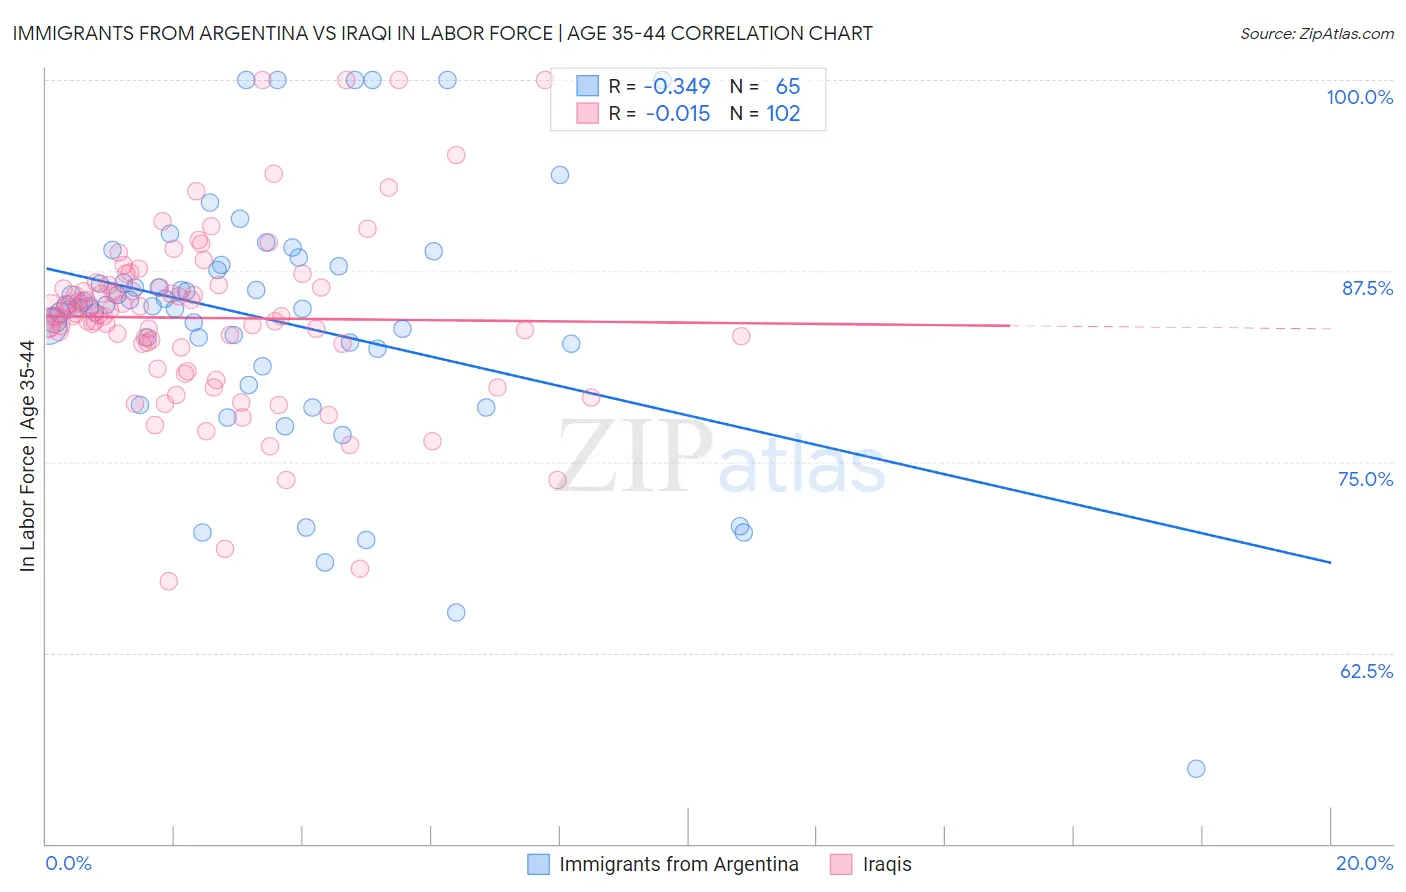
Immigrants from Argentina vs Iraqi In Labor Force | Age 35-44 Correlation Chart
The statistical analysis conducted on geographies consisting of 264,372,085 people shows a mild negative correlation between the proportion of Immigrants from Argentina and labor force participation rate among population between the ages 35 and 44 in the United States with a correlation coefficient (R) of -0.349 and weighted average of 84.8%. Similarly, the statistical analysis conducted on geographies consisting of 170,582,989 people shows no correlation between the proportion of Iraqis and labor force participation rate among population between the ages 35 and 44 in the United States with a correlation coefficient (R) of -0.015 and weighted average of 83.8%, a difference of 1.2%.
In Labor Force | Age 35-44 Correlation Summary
| Measurement | Immigrants from Argentina | Iraqi |
| Minimum | 54.9% | 67.2% |
| Maximum | 100.0% | 100.0% |
| Range | 45.1% | 32.8% |
| Mean | 84.3% | 84.4% |
| Median | 85.2% | 84.6% |
| Interquartile 25% (IQ1) | 81.8% | 82.7% |
| Interquartile 75% (IQ3) | 87.8% | 86.4% |
| Interquartile Range (IQR) | 6.0% | 3.7% |
| Standard Deviation (Sample) | 8.5% | 5.8% |
| Standard Deviation (Population) | 8.4% | 5.7% |
Similar Demographics by In Labor Force | Age 35-44
Demographics Similar to Immigrants from Argentina by In Labor Force | Age 35-44
In terms of in labor force | age 35-44, the demographic groups most similar to Immigrants from Argentina are Immigrants from Russia (84.8%, a difference of 0.0%), Immigrants from Bahamas (84.8%, a difference of 0.010%), Immigrants from Romania (84.8%, a difference of 0.010%), Immigrants from Belarus (84.8%, a difference of 0.020%), and Immigrants from Sweden (84.8%, a difference of 0.020%).
| Demographics | Rating | Rank | In Labor Force | Age 35-44 |
| Immigrants | Australia | 95.5 /100 | #101 | Exceptional 84.8% |
| Immigrants | Southern Europe | 95.3 /100 | #102 | Exceptional 84.8% |
| Immigrants | Belarus | 95.3 /100 | #103 | Exceptional 84.8% |
| Immigrants | Sweden | 95.2 /100 | #104 | Exceptional 84.8% |
| South Americans | 95.0 /100 | #105 | Exceptional 84.8% |
| Immigrants | Bahamas | 94.8 /100 | #106 | Exceptional 84.8% |
| Immigrants | Romania | 94.7 /100 | #107 | Exceptional 84.8% |
| Immigrants | Argentina | 94.5 /100 | #108 | Exceptional 84.8% |
| Immigrants | Russia | 94.5 /100 | #109 | Exceptional 84.8% |
| Filipinos | 93.8 /100 | #110 | Exceptional 84.7% |
| Ukrainians | 93.5 /100 | #111 | Exceptional 84.7% |
| Immigrants | Western Africa | 93.4 /100 | #112 | Exceptional 84.7% |
| Uruguayans | 93.3 /100 | #113 | Exceptional 84.7% |
| Chileans | 93.2 /100 | #114 | Exceptional 84.7% |
| Bahamians | 93.2 /100 | #115 | Exceptional 84.7% |
Demographics Similar to Iraqis by In Labor Force | Age 35-44
In terms of in labor force | age 35-44, the demographic groups most similar to Iraqis are Arab (83.8%, a difference of 0.0%), Celtic (83.8%, a difference of 0.010%), Immigrants from Cambodia (83.8%, a difference of 0.020%), Immigrants from Western Asia (83.8%, a difference of 0.030%), and Guyanese (83.8%, a difference of 0.030%).
| Demographics | Rating | Rank | In Labor Force | Age 35-44 |
| Immigrants | Oceania | 2.6 /100 | #234 | Tragic 83.9% |
| Immigrants | Syria | 2.5 /100 | #235 | Tragic 83.9% |
| West Indians | 2.4 /100 | #236 | Tragic 83.9% |
| English | 1.8 /100 | #237 | Tragic 83.8% |
| Immigrants | Laos | 1.7 /100 | #238 | Tragic 83.8% |
| Celtics | 1.4 /100 | #239 | Tragic 83.8% |
| Arabs | 1.3 /100 | #240 | Tragic 83.8% |
| Iraqis | 1.3 /100 | #241 | Tragic 83.8% |
| Immigrants | Cambodia | 1.1 /100 | #242 | Tragic 83.8% |
| Immigrants | Western Asia | 1.1 /100 | #243 | Tragic 83.8% |
| Guyanese | 1.1 /100 | #244 | Tragic 83.8% |
| Malaysians | 1.1 /100 | #245 | Tragic 83.8% |
| Immigrants | Immigrants | 1.0 /100 | #246 | Tragic 83.7% |
| Immigrants | Armenia | 0.9 /100 | #247 | Tragic 83.7% |
| Indonesians | 0.8 /100 | #248 | Tragic 83.7% |