Immigrants from Argentina vs Guatemalan In Labor Force | Age 35-44
COMPARE
Immigrants from Argentina
Guatemalan
In Labor Force | Age 35-44
In Labor Force | Age 35-44 Comparison
Immigrants from Argentina
Guatemalans
84.8%
IN LABOR FORCE | AGE 35-44
94.5/ 100
METRIC RATING
108th/ 347
METRIC RANK
83.0%
IN LABOR FORCE | AGE 35-44
0.0/ 100
METRIC RATING
281st/ 347
METRIC RANK
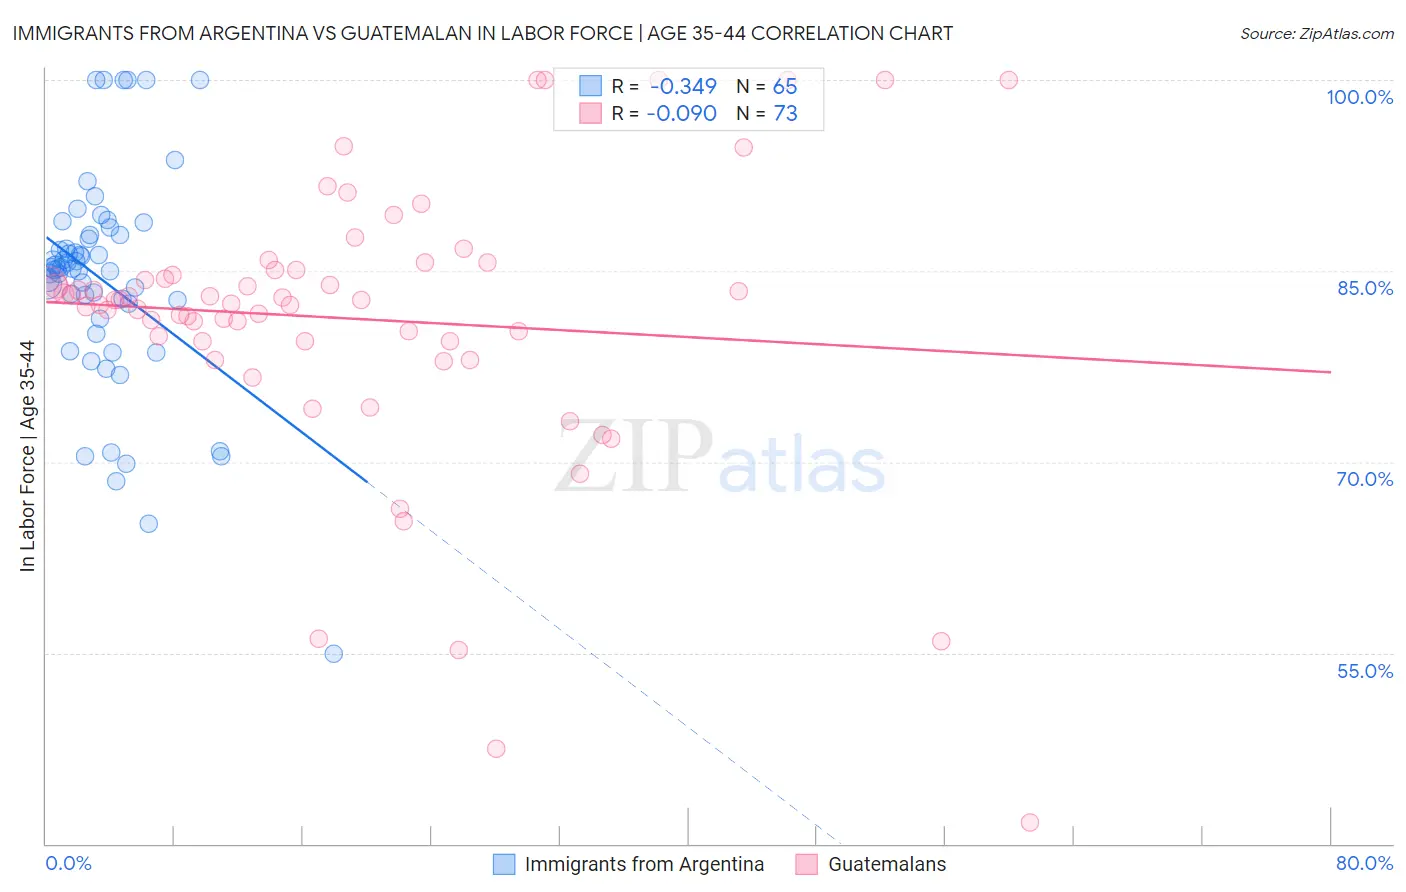
Immigrants from Argentina vs Guatemalan In Labor Force | Age 35-44 Correlation Chart
The statistical analysis conducted on geographies consisting of 264,372,085 people shows a mild negative correlation between the proportion of Immigrants from Argentina and labor force participation rate among population between the ages 35 and 44 in the United States with a correlation coefficient (R) of -0.349 and weighted average of 84.8%. Similarly, the statistical analysis conducted on geographies consisting of 409,363,843 people shows a slight negative correlation between the proportion of Guatemalans and labor force participation rate among population between the ages 35 and 44 in the United States with a correlation coefficient (R) of -0.090 and weighted average of 83.0%, a difference of 2.1%.
In Labor Force | Age 35-44 Correlation Summary
| Measurement | Immigrants from Argentina | Guatemalan |
| Minimum | 54.9% | 41.7% |
| Maximum | 100.0% | 100.0% |
| Range | 45.1% | 58.3% |
| Mean | 84.3% | 81.2% |
| Median | 85.2% | 82.7% |
| Interquartile 25% (IQ1) | 81.8% | 79.5% |
| Interquartile 75% (IQ3) | 87.8% | 85.1% |
| Interquartile Range (IQR) | 6.0% | 5.6% |
| Standard Deviation (Sample) | 8.5% | 11.0% |
| Standard Deviation (Population) | 8.4% | 11.0% |
Similar Demographics by In Labor Force | Age 35-44
Demographics Similar to Immigrants from Argentina by In Labor Force | Age 35-44
In terms of in labor force | age 35-44, the demographic groups most similar to Immigrants from Argentina are Immigrants from Russia (84.8%, a difference of 0.0%), Immigrants from Bahamas (84.8%, a difference of 0.010%), Immigrants from Romania (84.8%, a difference of 0.010%), Immigrants from Belarus (84.8%, a difference of 0.020%), and Immigrants from Sweden (84.8%, a difference of 0.020%).
| Demographics | Rating | Rank | In Labor Force | Age 35-44 |
| Immigrants | Australia | 95.5 /100 | #101 | Exceptional 84.8% |
| Immigrants | Southern Europe | 95.3 /100 | #102 | Exceptional 84.8% |
| Immigrants | Belarus | 95.3 /100 | #103 | Exceptional 84.8% |
| Immigrants | Sweden | 95.2 /100 | #104 | Exceptional 84.8% |
| South Americans | 95.0 /100 | #105 | Exceptional 84.8% |
| Immigrants | Bahamas | 94.8 /100 | #106 | Exceptional 84.8% |
| Immigrants | Romania | 94.7 /100 | #107 | Exceptional 84.8% |
| Immigrants | Argentina | 94.5 /100 | #108 | Exceptional 84.8% |
| Immigrants | Russia | 94.5 /100 | #109 | Exceptional 84.8% |
| Filipinos | 93.8 /100 | #110 | Exceptional 84.7% |
| Ukrainians | 93.5 /100 | #111 | Exceptional 84.7% |
| Immigrants | Western Africa | 93.4 /100 | #112 | Exceptional 84.7% |
| Uruguayans | 93.3 /100 | #113 | Exceptional 84.7% |
| Chileans | 93.2 /100 | #114 | Exceptional 84.7% |
| Bahamians | 93.2 /100 | #115 | Exceptional 84.7% |
Demographics Similar to Guatemalans by In Labor Force | Age 35-44
In terms of in labor force | age 35-44, the demographic groups most similar to Guatemalans are Osage (82.9%, a difference of 0.040%), Immigrants from Guatemala (82.9%, a difference of 0.040%), Immigrants from Dominican Republic (82.9%, a difference of 0.050%), Fijian (82.9%, a difference of 0.060%), and Immigrants from Bangladesh (82.9%, a difference of 0.060%).
| Demographics | Rating | Rank | In Labor Force | Age 35-44 |
| Immigrants | Nonimmigrants | 0.0 /100 | #274 | Tragic 83.2% |
| Hawaiians | 0.0 /100 | #275 | Tragic 83.2% |
| Delaware | 0.0 /100 | #276 | Tragic 83.2% |
| Samoans | 0.0 /100 | #277 | Tragic 83.2% |
| Belizeans | 0.0 /100 | #278 | Tragic 83.1% |
| Immigrants | Micronesia | 0.0 /100 | #279 | Tragic 83.1% |
| Dominicans | 0.0 /100 | #280 | Tragic 83.1% |
| Guatemalans | 0.0 /100 | #281 | Tragic 83.0% |
| Osage | 0.0 /100 | #282 | Tragic 82.9% |
| Immigrants | Guatemala | 0.0 /100 | #283 | Tragic 82.9% |
| Immigrants | Dominican Republic | 0.0 /100 | #284 | Tragic 82.9% |
| Fijians | 0.0 /100 | #285 | Tragic 82.9% |
| Immigrants | Bangladesh | 0.0 /100 | #286 | Tragic 82.9% |
| Immigrants | Belize | 0.0 /100 | #287 | Tragic 82.9% |
| Puget Sound Salish | 0.0 /100 | #288 | Tragic 82.9% |