German vs Immigrants from Armenia In Labor Force | Age 45-54
COMPARE
German
Immigrants from Armenia
In Labor Force | Age 45-54
In Labor Force | Age 45-54 Comparison
Germans
Immigrants from Armenia
83.1%
IN LABOR FORCE | AGE 45-54
85.1/ 100
METRIC RATING
128th/ 347
METRIC RANK
81.7%
IN LABOR FORCE | AGE 45-54
0.2/ 100
METRIC RATING
250th/ 347
METRIC RANK
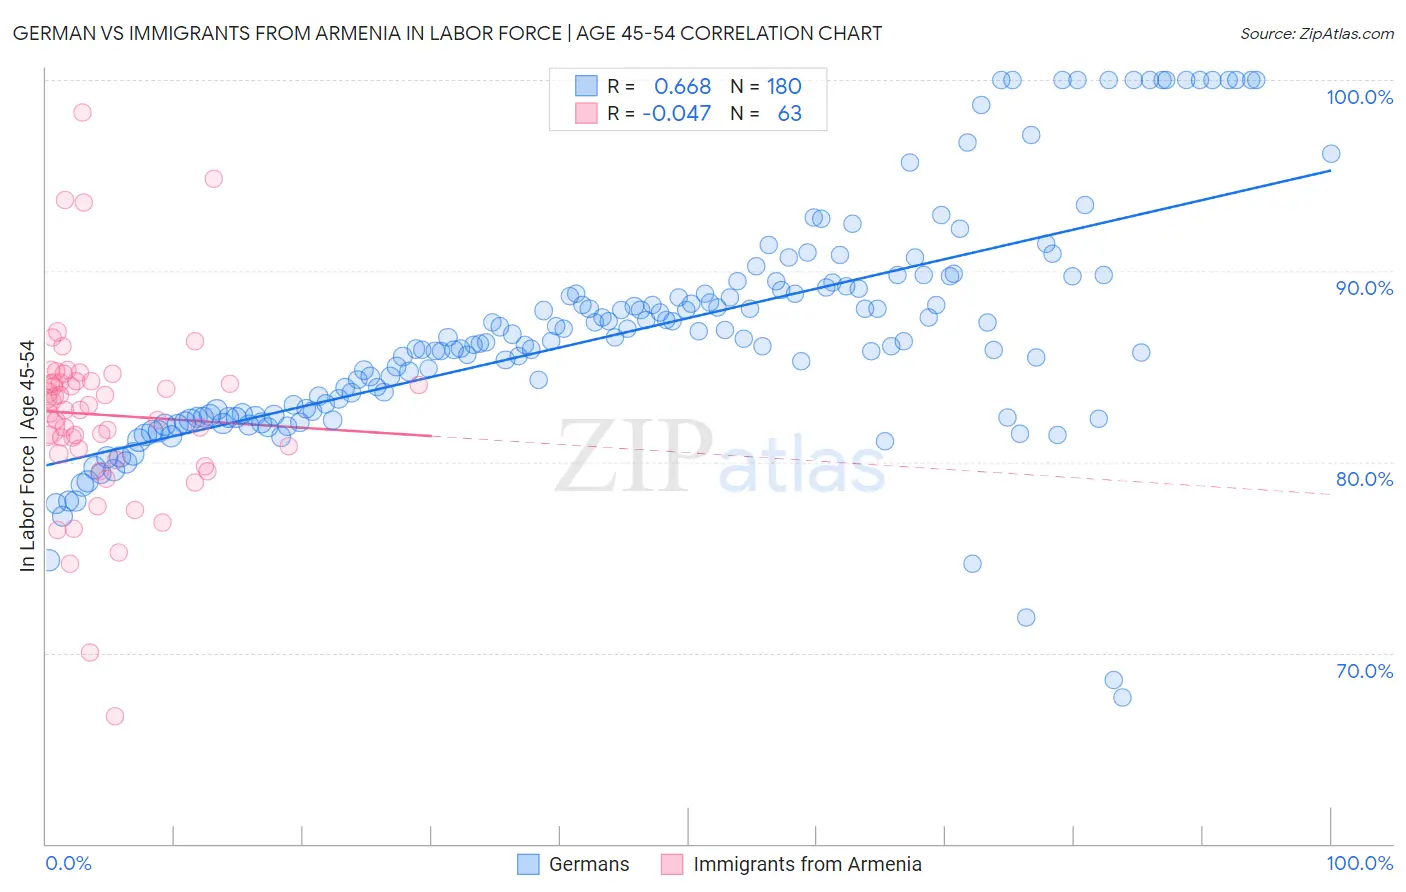
German vs Immigrants from Armenia In Labor Force | Age 45-54 Correlation Chart
The statistical analysis conducted on geographies consisting of 580,196,129 people shows a significant positive correlation between the proportion of Germans and labor force participation rate among population between the ages 45 and 54 in the United States with a correlation coefficient (R) of 0.668 and weighted average of 83.1%. Similarly, the statistical analysis conducted on geographies consisting of 97,712,930 people shows no correlation between the proportion of Immigrants from Armenia and labor force participation rate among population between the ages 45 and 54 in the United States with a correlation coefficient (R) of -0.047 and weighted average of 81.7%, a difference of 1.7%.
In Labor Force | Age 45-54 Correlation Summary
| Measurement | German | Immigrants from Armenia |
| Minimum | 67.7% | 66.7% |
| Maximum | 100.0% | 98.3% |
| Range | 32.3% | 31.6% |
| Mean | 86.8% | 82.5% |
| Median | 86.3% | 82.7% |
| Interquartile 25% (IQ1) | 82.4% | 80.4% |
| Interquartile 75% (IQ3) | 89.2% | 84.2% |
| Interquartile Range (IQR) | 6.7% | 3.8% |
| Standard Deviation (Sample) | 6.1% | 4.9% |
| Standard Deviation (Population) | 6.1% | 4.9% |
Similar Demographics by In Labor Force | Age 45-54
Demographics Similar to Germans by In Labor Force | Age 45-54
In terms of in labor force | age 45-54, the demographic groups most similar to Germans are Immigrants from Jordan (83.1%, a difference of 0.0%), Immigrants from Northern Europe (83.1%, a difference of 0.0%), Immigrants from Israel (83.1%, a difference of 0.010%), Immigrants from Belgium (83.1%, a difference of 0.020%), and Finnish (83.1%, a difference of 0.030%).
| Demographics | Rating | Rank | In Labor Force | Age 45-54 |
| Uruguayans | 89.4 /100 | #121 | Excellent 83.1% |
| Immigrants | Vietnam | 88.9 /100 | #122 | Excellent 83.1% |
| Tongans | 88.2 /100 | #123 | Excellent 83.1% |
| Bermudans | 88.0 /100 | #124 | Excellent 83.1% |
| Immigrants | Iran | 87.2 /100 | #125 | Excellent 83.1% |
| Immigrants | Belgium | 86.4 /100 | #126 | Excellent 83.1% |
| Immigrants | Jordan | 85.2 /100 | #127 | Excellent 83.1% |
| Germans | 85.1 /100 | #128 | Excellent 83.1% |
| Immigrants | Northern Europe | 85.1 /100 | #129 | Excellent 83.1% |
| Immigrants | Israel | 84.7 /100 | #130 | Excellent 83.1% |
| Finns | 83.3 /100 | #131 | Excellent 83.1% |
| Immigrants | Ukraine | 82.9 /100 | #132 | Excellent 83.0% |
| Liberians | 82.7 /100 | #133 | Excellent 83.0% |
| Sudanese | 82.0 /100 | #134 | Excellent 83.0% |
| Austrians | 81.3 /100 | #135 | Excellent 83.0% |
Demographics Similar to Immigrants from Armenia by In Labor Force | Age 45-54
In terms of in labor force | age 45-54, the demographic groups most similar to Immigrants from Armenia are Guamanian/Chamorro (81.6%, a difference of 0.020%), Pennsylvania German (81.6%, a difference of 0.040%), Hmong (81.7%, a difference of 0.050%), Puget Sound Salish (81.7%, a difference of 0.070%), and Japanese (81.6%, a difference of 0.070%).
| Demographics | Rating | Rank | In Labor Force | Age 45-54 |
| Samoans | 0.6 /100 | #243 | Tragic 81.8% |
| Celtics | 0.4 /100 | #244 | Tragic 81.8% |
| Alaska Natives | 0.4 /100 | #245 | Tragic 81.8% |
| Alaskan Athabascans | 0.4 /100 | #246 | Tragic 81.8% |
| Central Americans | 0.4 /100 | #247 | Tragic 81.7% |
| Puget Sound Salish | 0.3 /100 | #248 | Tragic 81.7% |
| Hmong | 0.3 /100 | #249 | Tragic 81.7% |
| Immigrants | Armenia | 0.2 /100 | #250 | Tragic 81.7% |
| Guamanians/Chamorros | 0.2 /100 | #251 | Tragic 81.6% |
| Pennsylvania Germans | 0.2 /100 | #252 | Tragic 81.6% |
| Japanese | 0.2 /100 | #253 | Tragic 81.6% |
| Immigrants | Laos | 0.2 /100 | #254 | Tragic 81.6% |
| Scotch-Irish | 0.2 /100 | #255 | Tragic 81.6% |
| Barbadians | 0.1 /100 | #256 | Tragic 81.6% |
| Immigrants | Congo | 0.1 /100 | #257 | Tragic 81.6% |