German vs French American Indian In Labor Force | Age 45-54
COMPARE
German
French American Indian
In Labor Force | Age 45-54
In Labor Force | Age 45-54 Comparison
Germans
French American Indians
83.1%
IN LABOR FORCE | AGE 45-54
85.1/ 100
METRIC RATING
128th/ 347
METRIC RANK
80.8%
IN LABOR FORCE | AGE 45-54
0.0/ 100
METRIC RATING
283rd/ 347
METRIC RANK
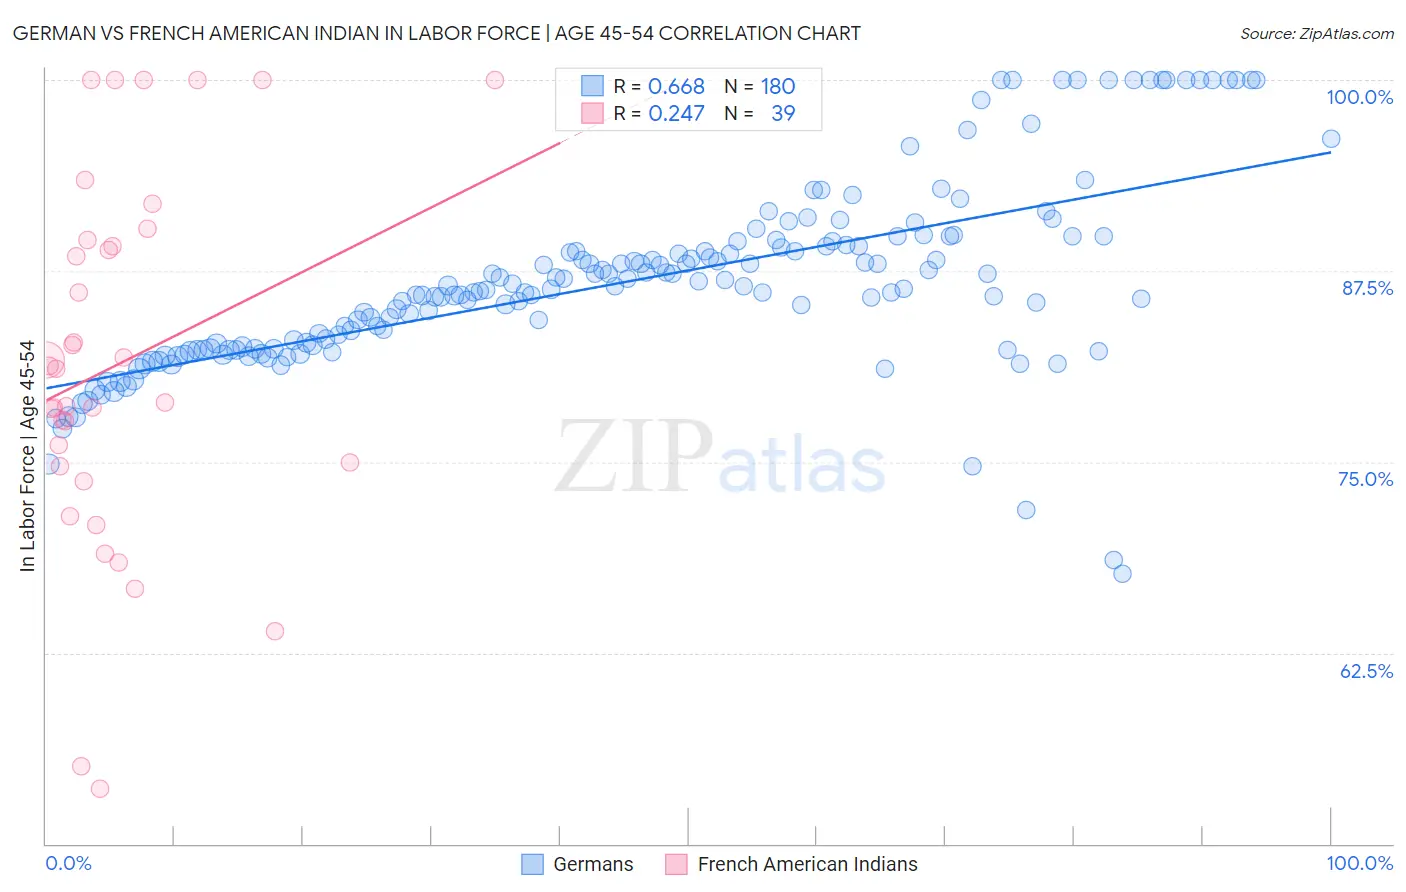
German vs French American Indian In Labor Force | Age 45-54 Correlation Chart
The statistical analysis conducted on geographies consisting of 580,196,129 people shows a significant positive correlation between the proportion of Germans and labor force participation rate among population between the ages 45 and 54 in the United States with a correlation coefficient (R) of 0.668 and weighted average of 83.1%. Similarly, the statistical analysis conducted on geographies consisting of 131,958,652 people shows a weak positive correlation between the proportion of French American Indians and labor force participation rate among population between the ages 45 and 54 in the United States with a correlation coefficient (R) of 0.247 and weighted average of 80.8%, a difference of 2.8%.
In Labor Force | Age 45-54 Correlation Summary
| Measurement | German | French American Indian |
| Minimum | 67.7% | 53.6% |
| Maximum | 100.0% | 100.0% |
| Range | 32.3% | 46.4% |
| Mean | 86.8% | 81.4% |
| Median | 86.3% | 81.1% |
| Interquartile 25% (IQ1) | 82.4% | 74.7% |
| Interquartile 75% (IQ3) | 89.2% | 89.5% |
| Interquartile Range (IQR) | 6.7% | 14.8% |
| Standard Deviation (Sample) | 6.1% | 11.9% |
| Standard Deviation (Population) | 6.1% | 11.8% |
Similar Demographics by In Labor Force | Age 45-54
Demographics Similar to Germans by In Labor Force | Age 45-54
In terms of in labor force | age 45-54, the demographic groups most similar to Germans are Immigrants from Jordan (83.1%, a difference of 0.0%), Immigrants from Northern Europe (83.1%, a difference of 0.0%), Immigrants from Israel (83.1%, a difference of 0.010%), Immigrants from Belgium (83.1%, a difference of 0.020%), and Finnish (83.1%, a difference of 0.030%).
| Demographics | Rating | Rank | In Labor Force | Age 45-54 |
| Uruguayans | 89.4 /100 | #121 | Excellent 83.1% |
| Immigrants | Vietnam | 88.9 /100 | #122 | Excellent 83.1% |
| Tongans | 88.2 /100 | #123 | Excellent 83.1% |
| Bermudans | 88.0 /100 | #124 | Excellent 83.1% |
| Immigrants | Iran | 87.2 /100 | #125 | Excellent 83.1% |
| Immigrants | Belgium | 86.4 /100 | #126 | Excellent 83.1% |
| Immigrants | Jordan | 85.2 /100 | #127 | Excellent 83.1% |
| Germans | 85.1 /100 | #128 | Excellent 83.1% |
| Immigrants | Northern Europe | 85.1 /100 | #129 | Excellent 83.1% |
| Immigrants | Israel | 84.7 /100 | #130 | Excellent 83.1% |
| Finns | 83.3 /100 | #131 | Excellent 83.1% |
| Immigrants | Ukraine | 82.9 /100 | #132 | Excellent 83.0% |
| Liberians | 82.7 /100 | #133 | Excellent 83.0% |
| Sudanese | 82.0 /100 | #134 | Excellent 83.0% |
| Austrians | 81.3 /100 | #135 | Excellent 83.0% |
Demographics Similar to French American Indians by In Labor Force | Age 45-54
In terms of in labor force | age 45-54, the demographic groups most similar to French American Indians are Belizean (80.8%, a difference of 0.050%), Delaware (80.8%, a difference of 0.060%), Immigrants from Dominica (80.8%, a difference of 0.060%), Vietnamese (80.8%, a difference of 0.070%), and Cree (80.8%, a difference of 0.070%).
| Demographics | Rating | Rank | In Labor Force | Age 45-54 |
| U.S. Virgin Islanders | 0.0 /100 | #276 | Tragic 81.2% |
| Guatemalans | 0.0 /100 | #277 | Tragic 81.2% |
| Immigrants | Guatemala | 0.0 /100 | #278 | Tragic 81.1% |
| Immigrants | Micronesia | 0.0 /100 | #279 | Tragic 81.1% |
| Immigrants | Latin America | 0.0 /100 | #280 | Tragic 81.0% |
| Immigrants | Grenada | 0.0 /100 | #281 | Tragic 81.0% |
| Aleuts | 0.0 /100 | #282 | Tragic 81.0% |
| French American Indians | 0.0 /100 | #283 | Tragic 80.8% |
| Belizeans | 0.0 /100 | #284 | Tragic 80.8% |
| Delaware | 0.0 /100 | #285 | Tragic 80.8% |
| Immigrants | Dominica | 0.0 /100 | #286 | Tragic 80.8% |
| Vietnamese | 0.0 /100 | #287 | Tragic 80.8% |
| Cree | 0.0 /100 | #288 | Tragic 80.8% |
| Immigrants | Bangladesh | 0.0 /100 | #289 | Tragic 80.7% |
| Mexican American Indians | 0.0 /100 | #290 | Tragic 80.7% |