German Russian vs Somali In Labor Force | Age 35-44
COMPARE
German Russian
Somali
In Labor Force | Age 35-44
In Labor Force | Age 35-44 Comparison
German Russians
Somalis
85.2%
IN LABOR FORCE | AGE 35-44
99.8/ 100
METRIC RATING
47th/ 347
METRIC RANK
85.6%
IN LABOR FORCE | AGE 35-44
100.0/ 100
METRIC RATING
13th/ 347
METRIC RANK
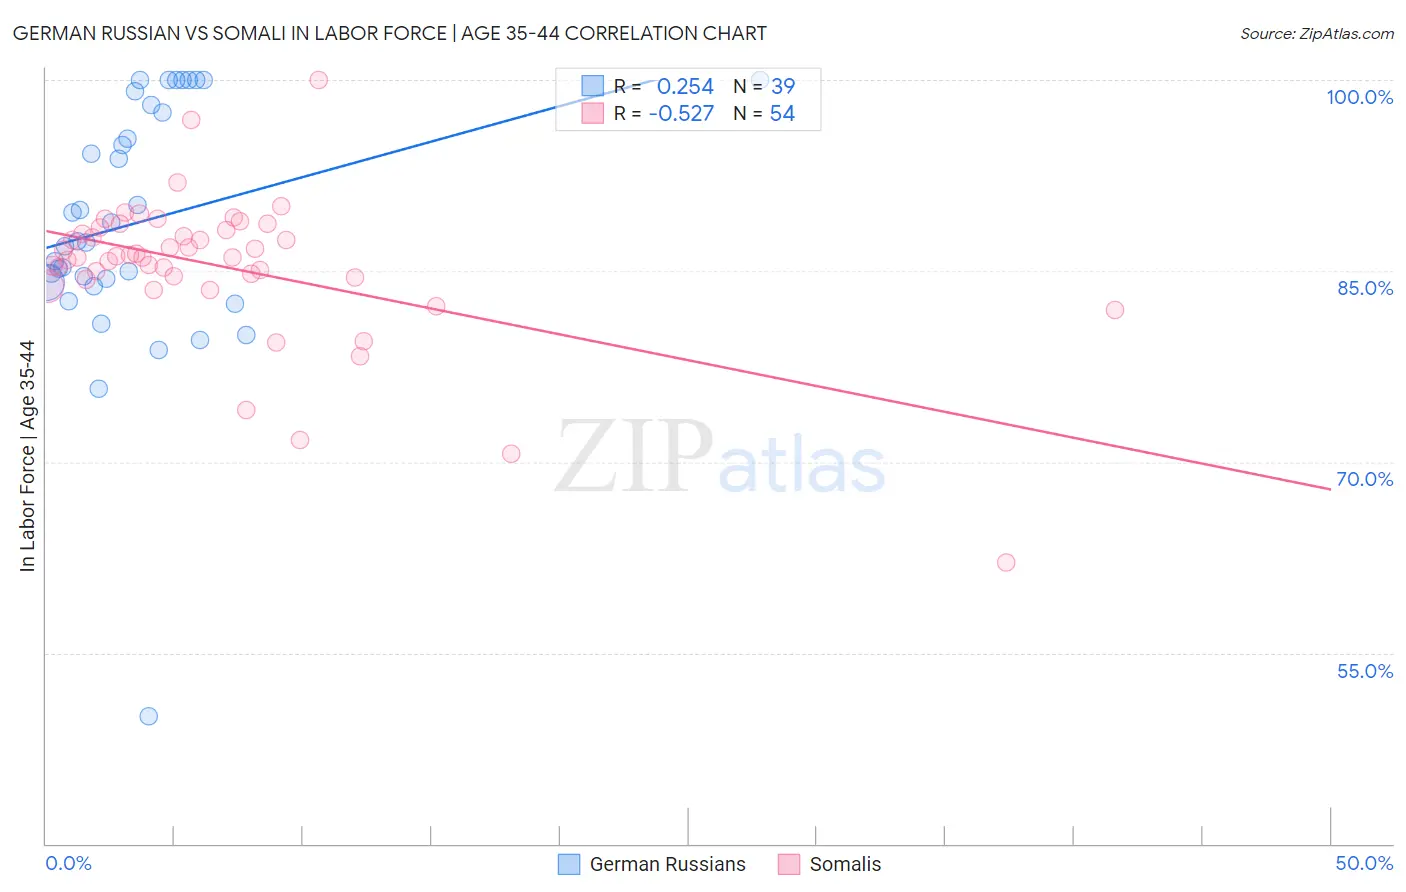
German Russian vs Somali In Labor Force | Age 35-44 Correlation Chart
The statistical analysis conducted on geographies consisting of 96,445,215 people shows a weak positive correlation between the proportion of German Russians and labor force participation rate among population between the ages 35 and 44 in the United States with a correlation coefficient (R) of 0.254 and weighted average of 85.2%. Similarly, the statistical analysis conducted on geographies consisting of 99,300,084 people shows a substantial negative correlation between the proportion of Somalis and labor force participation rate among population between the ages 35 and 44 in the United States with a correlation coefficient (R) of -0.527 and weighted average of 85.6%, a difference of 0.53%.
In Labor Force | Age 35-44 Correlation Summary
| Measurement | German Russian | Somali |
| Minimum | 50.0% | 62.1% |
| Maximum | 100.0% | 100.0% |
| Range | 50.0% | 37.9% |
| Mean | 88.9% | 85.4% |
| Median | 87.4% | 86.1% |
| Interquartile 25% (IQ1) | 84.1% | 84.5% |
| Interquartile 75% (IQ3) | 98.0% | 88.2% |
| Interquartile Range (IQR) | 13.9% | 3.7% |
| Standard Deviation (Sample) | 9.8% | 5.8% |
| Standard Deviation (Population) | 9.7% | 5.8% |
Similar Demographics by In Labor Force | Age 35-44
Demographics Similar to German Russians by In Labor Force | Age 35-44
In terms of in labor force | age 35-44, the demographic groups most similar to German Russians are Cypriot (85.2%, a difference of 0.010%), Immigrants from Hong Kong (85.2%, a difference of 0.010%), Immigrants from Eritrea (85.2%, a difference of 0.010%), Croatian (85.2%, a difference of 0.010%), and Polish (85.2%, a difference of 0.030%).
| Demographics | Rating | Rank | In Labor Force | Age 35-44 |
| Immigrants | Bulgaria | 99.8 /100 | #40 | Exceptional 85.2% |
| Immigrants | Zimbabwe | 99.8 /100 | #41 | Exceptional 85.2% |
| Macedonians | 99.8 /100 | #42 | Exceptional 85.2% |
| Poles | 99.8 /100 | #43 | Exceptional 85.2% |
| Lithuanians | 99.8 /100 | #44 | Exceptional 85.2% |
| Cypriots | 99.8 /100 | #45 | Exceptional 85.2% |
| Immigrants | Hong Kong | 99.8 /100 | #46 | Exceptional 85.2% |
| German Russians | 99.8 /100 | #47 | Exceptional 85.2% |
| Immigrants | Eritrea | 99.7 /100 | #48 | Exceptional 85.2% |
| Croatians | 99.7 /100 | #49 | Exceptional 85.2% |
| Thais | 99.7 /100 | #50 | Exceptional 85.2% |
| Immigrants | Albania | 99.7 /100 | #51 | Exceptional 85.1% |
| Immigrants | Kenya | 99.6 /100 | #52 | Exceptional 85.1% |
| Taiwanese | 99.6 /100 | #53 | Exceptional 85.1% |
| Turks | 99.5 /100 | #54 | Exceptional 85.1% |
Demographics Similar to Somalis by In Labor Force | Age 35-44
In terms of in labor force | age 35-44, the demographic groups most similar to Somalis are Immigrants from Somalia (85.6%, a difference of 0.0%), Liberian (85.7%, a difference of 0.020%), Norwegian (85.6%, a difference of 0.040%), Immigrants from Ireland (85.6%, a difference of 0.040%), and Immigrants from North Macedonia (85.6%, a difference of 0.090%).
| Demographics | Rating | Rank | In Labor Force | Age 35-44 |
| Bolivians | 100.0 /100 | #6 | Exceptional 86.1% |
| Immigrants | Sierra Leone | 100.0 /100 | #7 | Exceptional 86.1% |
| Immigrants | Ethiopia | 100.0 /100 | #8 | Exceptional 85.9% |
| Ethiopians | 100.0 /100 | #9 | Exceptional 85.9% |
| Cape Verdeans | 100.0 /100 | #10 | Exceptional 85.8% |
| Immigrants | Cameroon | 100.0 /100 | #11 | Exceptional 85.8% |
| Liberians | 100.0 /100 | #12 | Exceptional 85.7% |
| Somalis | 100.0 /100 | #13 | Exceptional 85.6% |
| Immigrants | Somalia | 100.0 /100 | #14 | Exceptional 85.6% |
| Norwegians | 100.0 /100 | #15 | Exceptional 85.6% |
| Immigrants | Ireland | 100.0 /100 | #16 | Exceptional 85.6% |
| Immigrants | North Macedonia | 100.0 /100 | #17 | Exceptional 85.6% |
| Carpatho Rusyns | 100.0 /100 | #18 | Exceptional 85.6% |
| Slovenes | 100.0 /100 | #19 | Exceptional 85.6% |
| Immigrants | Serbia | 100.0 /100 | #20 | Exceptional 85.5% |