European vs Immigrants from Pakistan In Labor Force | Age 20-24
COMPARE
European
Immigrants from Pakistan
In Labor Force | Age 20-24
In Labor Force | Age 20-24 Comparison
Europeans
Immigrants from Pakistan
77.1%
IN LABOR FORCE | AGE 20-24
99.9/ 100
METRIC RATING
56th/ 347
METRIC RANK
73.8%
IN LABOR FORCE | AGE 20-24
0.9/ 100
METRIC RATING
255th/ 347
METRIC RANK
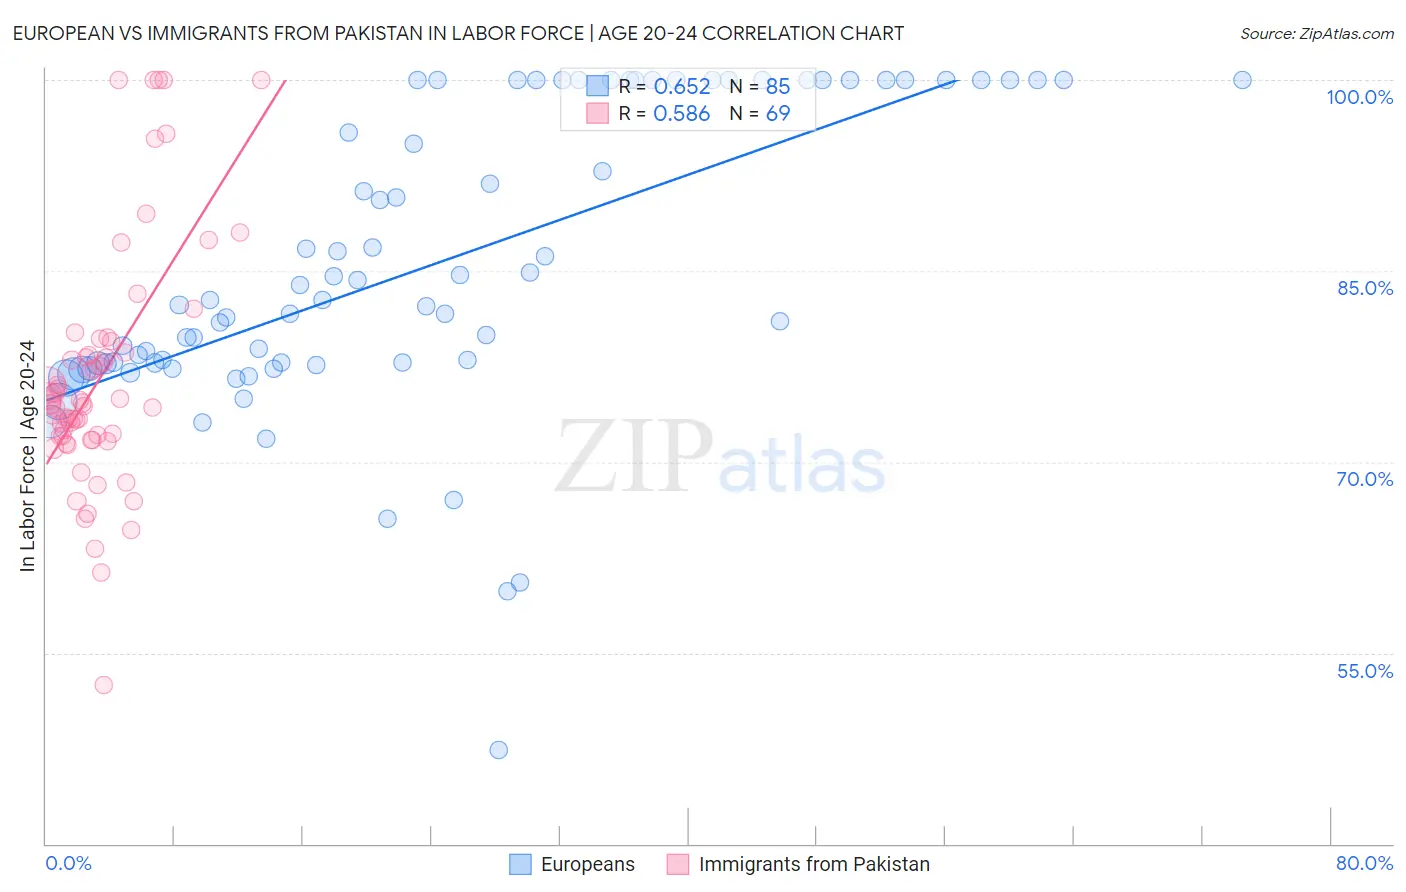
European vs Immigrants from Pakistan In Labor Force | Age 20-24 Correlation Chart
The statistical analysis conducted on geographies consisting of 560,672,794 people shows a significant positive correlation between the proportion of Europeans and labor force participation rate among population between the ages 20 and 24 in the United States with a correlation coefficient (R) of 0.652 and weighted average of 77.1%. Similarly, the statistical analysis conducted on geographies consisting of 283,855,002 people shows a substantial positive correlation between the proportion of Immigrants from Pakistan and labor force participation rate among population between the ages 20 and 24 in the United States with a correlation coefficient (R) of 0.586 and weighted average of 73.8%, a difference of 4.5%.
In Labor Force | Age 20-24 Correlation Summary
| Measurement | European | Immigrants from Pakistan |
| Minimum | 47.4% | 52.5% |
| Maximum | 100.0% | 100.0% |
| Range | 52.6% | 47.5% |
| Mean | 85.5% | 76.7% |
| Median | 82.7% | 74.6% |
| Interquartile 25% (IQ1) | 77.7% | 71.9% |
| Interquartile 75% (IQ3) | 100.0% | 79.0% |
| Interquartile Range (IQR) | 22.3% | 7.2% |
| Standard Deviation (Sample) | 11.7% | 9.6% |
| Standard Deviation (Population) | 11.6% | 9.5% |
Similar Demographics by In Labor Force | Age 20-24
Demographics Similar to Europeans by In Labor Force | Age 20-24
In terms of in labor force | age 20-24, the demographic groups most similar to Europeans are Immigrants from Liberia (77.1%, a difference of 0.010%), Chippewa (77.1%, a difference of 0.020%), Celtic (77.1%, a difference of 0.030%), Hawaiian (77.0%, a difference of 0.040%), and Scotch-Irish (77.0%, a difference of 0.060%).
| Demographics | Rating | Rank | In Labor Force | Age 20-24 |
| Chinese | 100.0 /100 | #49 | Exceptional 77.3% |
| Malaysians | 100.0 /100 | #50 | Exceptional 77.2% |
| Croatians | 100.0 /100 | #51 | Exceptional 77.2% |
| Indonesians | 100.0 /100 | #52 | Exceptional 77.2% |
| Immigrants | Azores | 100.0 /100 | #53 | Exceptional 77.2% |
| Celtics | 99.9 /100 | #54 | Exceptional 77.1% |
| Immigrants | Liberia | 99.9 /100 | #55 | Exceptional 77.1% |
| Europeans | 99.9 /100 | #56 | Exceptional 77.1% |
| Chippewa | 99.9 /100 | #57 | Exceptional 77.1% |
| Hawaiians | 99.9 /100 | #58 | Exceptional 77.0% |
| Scotch-Irish | 99.9 /100 | #59 | Exceptional 77.0% |
| Kenyans | 99.9 /100 | #60 | Exceptional 77.0% |
| Immigrants | Eritrea | 99.9 /100 | #61 | Exceptional 77.0% |
| Immigrants | Kenya | 99.9 /100 | #62 | Exceptional 77.0% |
| Lithuanians | 99.9 /100 | #63 | Exceptional 77.0% |
Demographics Similar to Immigrants from Pakistan by In Labor Force | Age 20-24
In terms of in labor force | age 20-24, the demographic groups most similar to Immigrants from Pakistan are Ute (73.8%, a difference of 0.020%), Arapaho (73.8%, a difference of 0.030%), Spanish American Indian (73.7%, a difference of 0.040%), Paraguayan (73.7%, a difference of 0.060%), and Immigrants from Kazakhstan (73.8%, a difference of 0.070%).
| Demographics | Rating | Rank | In Labor Force | Age 20-24 |
| Immigrants | Saudi Arabia | 1.5 /100 | #248 | Tragic 73.9% |
| Blacks/African Americans | 1.3 /100 | #249 | Tragic 73.9% |
| Immigrants | Belgium | 1.3 /100 | #250 | Tragic 73.9% |
| Immigrants | Egypt | 1.2 /100 | #251 | Tragic 73.8% |
| Immigrants | Kazakhstan | 1.1 /100 | #252 | Tragic 73.8% |
| Arapaho | 1.0 /100 | #253 | Tragic 73.8% |
| Ute | 1.0 /100 | #254 | Tragic 73.8% |
| Immigrants | Pakistan | 0.9 /100 | #255 | Tragic 73.8% |
| Spanish American Indians | 0.8 /100 | #256 | Tragic 73.7% |
| Paraguayans | 0.8 /100 | #257 | Tragic 73.7% |
| Egyptians | 0.7 /100 | #258 | Tragic 73.7% |
| Dutch West Indians | 0.7 /100 | #259 | Tragic 73.7% |
| Immigrants | Turkey | 0.7 /100 | #260 | Tragic 73.7% |
| Houma | 0.6 /100 | #261 | Tragic 73.7% |
| Asians | 0.6 /100 | #262 | Tragic 73.7% |