Croatian vs Ottawa In Labor Force | Age 30-34
COMPARE
Croatian
Ottawa
In Labor Force | Age 30-34
In Labor Force | Age 30-34 Comparison
Croatians
Ottawa
85.6%
IN LABOR FORCE | AGE 30-34
99.8/ 100
METRIC RATING
47th/ 347
METRIC RANK
82.4%
IN LABOR FORCE | AGE 30-34
0.0/ 100
METRIC RATING
302nd/ 347
METRIC RANK
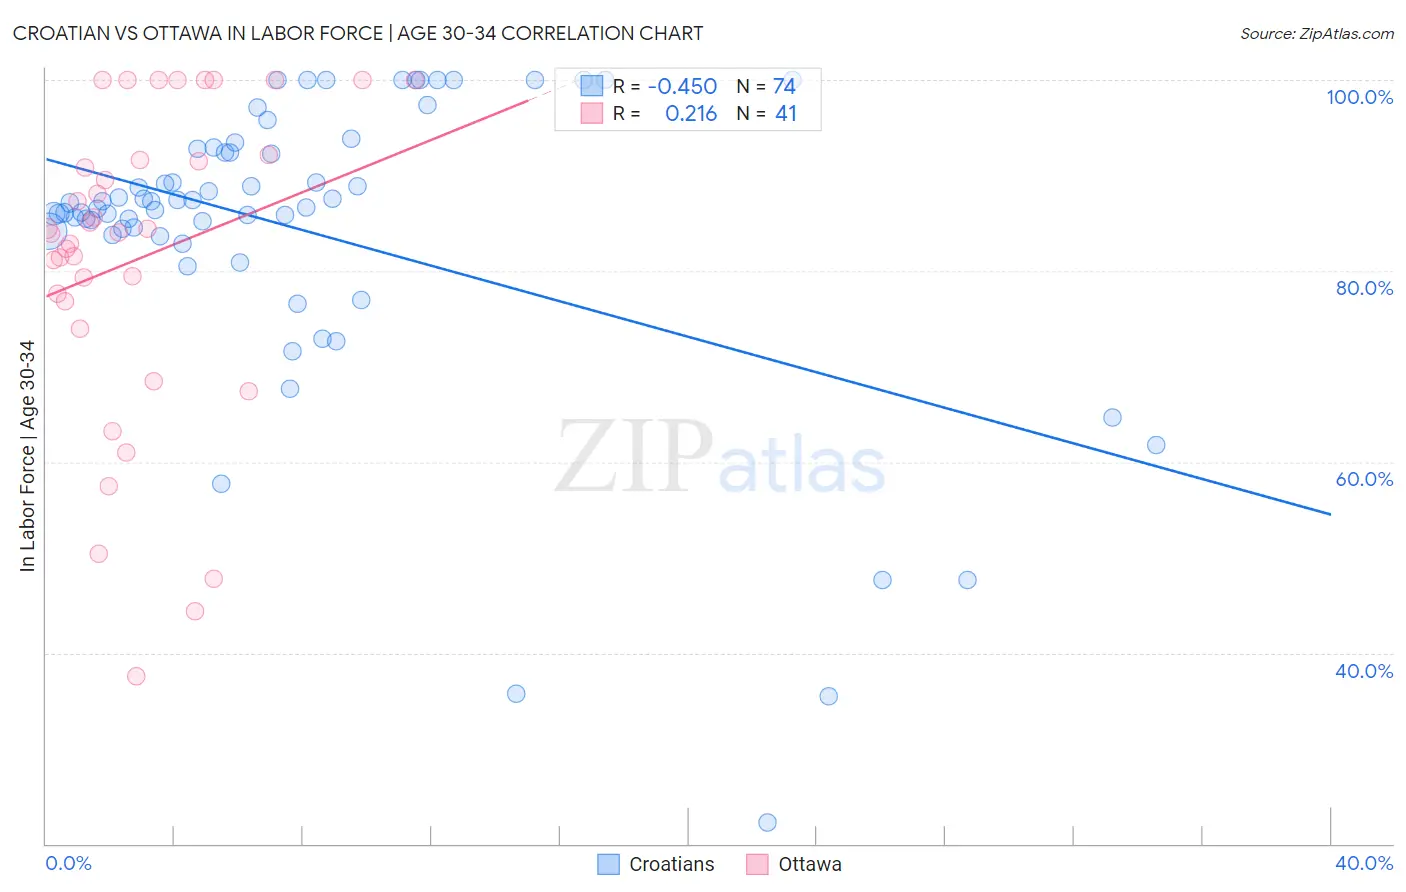
Croatian vs Ottawa In Labor Force | Age 30-34 Correlation Chart
The statistical analysis conducted on geographies consisting of 375,472,504 people shows a moderate negative correlation between the proportion of Croatians and labor force participation rate among population between the ages 30 and 34 in the United States with a correlation coefficient (R) of -0.450 and weighted average of 85.6%. Similarly, the statistical analysis conducted on geographies consisting of 49,951,540 people shows a weak positive correlation between the proportion of Ottawa and labor force participation rate among population between the ages 30 and 34 in the United States with a correlation coefficient (R) of 0.216 and weighted average of 82.4%, a difference of 3.9%.
In Labor Force | Age 30-34 Correlation Summary
| Measurement | Croatian | Ottawa |
| Minimum | 22.2% | 37.5% |
| Maximum | 100.0% | 100.0% |
| Range | 77.8% | 62.5% |
| Mean | 84.1% | 81.3% |
| Median | 86.9% | 84.0% |
| Interquartile 25% (IQ1) | 83.7% | 75.4% |
| Interquartile 75% (IQ3) | 92.8% | 91.9% |
| Interquartile Range (IQR) | 9.0% | 16.5% |
| Standard Deviation (Sample) | 15.7% | 16.5% |
| Standard Deviation (Population) | 15.6% | 16.3% |
Similar Demographics by In Labor Force | Age 30-34
Demographics Similar to Croatians by In Labor Force | Age 30-34
In terms of in labor force | age 30-34, the demographic groups most similar to Croatians are Immigrants from Morocco (85.6%, a difference of 0.0%), Immigrants from Sri Lanka (85.6%, a difference of 0.010%), Immigrants from Nepal (85.6%, a difference of 0.010%), Immigrants from Sweden (85.6%, a difference of 0.020%), and Lithuanian (85.6%, a difference of 0.020%).
| Demographics | Rating | Rank | In Labor Force | Age 30-34 |
| Turks | 99.9 /100 | #40 | Exceptional 85.7% |
| Immigrants | Italy | 99.9 /100 | #41 | Exceptional 85.7% |
| Zimbabweans | 99.8 /100 | #42 | Exceptional 85.6% |
| Immigrants | Lithuania | 99.8 /100 | #43 | Exceptional 85.6% |
| Immigrants | Sri Lanka | 99.8 /100 | #44 | Exceptional 85.6% |
| Immigrants | Nepal | 99.8 /100 | #45 | Exceptional 85.6% |
| Immigrants | Morocco | 99.8 /100 | #46 | Exceptional 85.6% |
| Croatians | 99.8 /100 | #47 | Exceptional 85.6% |
| Immigrants | Sweden | 99.8 /100 | #48 | Exceptional 85.6% |
| Lithuanians | 99.8 /100 | #49 | Exceptional 85.6% |
| Immigrants | Australia | 99.8 /100 | #50 | Exceptional 85.6% |
| Cape Verdeans | 99.7 /100 | #51 | Exceptional 85.6% |
| Slovenes | 99.7 /100 | #52 | Exceptional 85.6% |
| Filipinos | 99.6 /100 | #53 | Exceptional 85.5% |
| Immigrants | Kenya | 99.6 /100 | #54 | Exceptional 85.5% |
Demographics Similar to Ottawa by In Labor Force | Age 30-34
In terms of in labor force | age 30-34, the demographic groups most similar to Ottawa are Immigrants from Micronesia (82.4%, a difference of 0.010%), Hispanic or Latino (82.4%, a difference of 0.030%), Hmong (82.4%, a difference of 0.040%), Tlingit-Haida (82.3%, a difference of 0.090%), and Immigrants from Central America (82.5%, a difference of 0.10%).
| Demographics | Rating | Rank | In Labor Force | Age 30-34 |
| Pennsylvania Germans | 0.0 /100 | #295 | Tragic 82.6% |
| Chippewa | 0.0 /100 | #296 | Tragic 82.6% |
| Comanche | 0.0 /100 | #297 | Tragic 82.6% |
| Aleuts | 0.0 /100 | #298 | Tragic 82.6% |
| Immigrants | Central America | 0.0 /100 | #299 | Tragic 82.5% |
| Hmong | 0.0 /100 | #300 | Tragic 82.4% |
| Hispanics or Latinos | 0.0 /100 | #301 | Tragic 82.4% |
| Ottawa | 0.0 /100 | #302 | Tragic 82.4% |
| Immigrants | Micronesia | 0.0 /100 | #303 | Tragic 82.4% |
| Tlingit-Haida | 0.0 /100 | #304 | Tragic 82.3% |
| Osage | 0.0 /100 | #305 | Tragic 82.3% |
| Spanish American Indians | 0.0 /100 | #306 | Tragic 82.2% |
| Menominee | 0.0 /100 | #307 | Tragic 82.2% |
| Puget Sound Salish | 0.0 /100 | #308 | Tragic 82.1% |
| Immigrants | Mexico | 0.0 /100 | #309 | Tragic 82.0% |