Australian vs Czech In Labor Force | Age 30-34
COMPARE
Australian
Czech
In Labor Force | Age 30-34
In Labor Force | Age 30-34 Comparison
Australians
Czechs
85.0%
IN LABOR FORCE | AGE 30-34
92.0/ 100
METRIC RATING
124th/ 347
METRIC RANK
85.5%
IN LABOR FORCE | AGE 30-34
99.6/ 100
METRIC RATING
56th/ 347
METRIC RANK
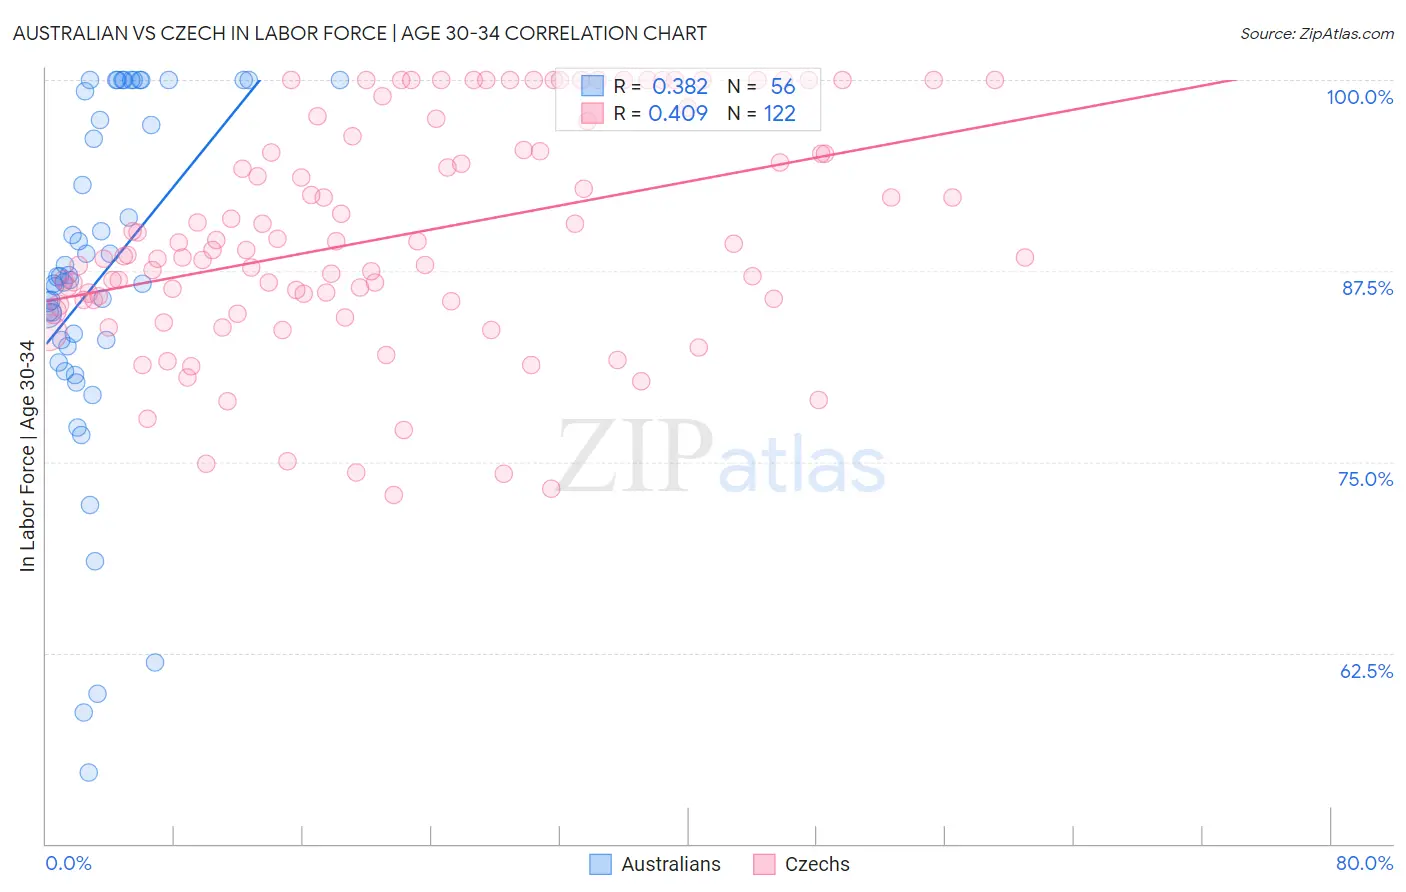
Australian vs Czech In Labor Force | Age 30-34 Correlation Chart
The statistical analysis conducted on geographies consisting of 224,058,107 people shows a mild positive correlation between the proportion of Australians and labor force participation rate among population between the ages 30 and 34 in the United States with a correlation coefficient (R) of 0.382 and weighted average of 85.0%. Similarly, the statistical analysis conducted on geographies consisting of 484,299,393 people shows a moderate positive correlation between the proportion of Czechs and labor force participation rate among population between the ages 30 and 34 in the United States with a correlation coefficient (R) of 0.409 and weighted average of 85.5%, a difference of 0.53%.
In Labor Force | Age 30-34 Correlation Summary
| Measurement | Australian | Czech |
| Minimum | 54.7% | 72.8% |
| Maximum | 100.0% | 100.0% |
| Range | 45.3% | 27.2% |
| Mean | 87.1% | 89.8% |
| Median | 87.0% | 88.7% |
| Interquartile 25% (IQ1) | 82.8% | 85.6% |
| Interquartile 75% (IQ3) | 98.3% | 95.4% |
| Interquartile Range (IQR) | 15.5% | 9.8% |
| Standard Deviation (Sample) | 11.3% | 7.3% |
| Standard Deviation (Population) | 11.2% | 7.3% |
Similar Demographics by In Labor Force | Age 30-34
Demographics Similar to Australians by In Labor Force | Age 30-34
In terms of in labor force | age 30-34, the demographic groups most similar to Australians are Armenian (85.0%, a difference of 0.0%), Immigrants from Kuwait (85.1%, a difference of 0.010%), Immigrants from Jordan (85.0%, a difference of 0.010%), Austrian (85.0%, a difference of 0.020%), and Immigrants from Southern Europe (85.1%, a difference of 0.030%).
| Demographics | Rating | Rank | In Labor Force | Age 30-34 |
| Immigrants | Denmark | 94.3 /100 | #117 | Exceptional 85.1% |
| Immigrants | Malaysia | 94.2 /100 | #118 | Exceptional 85.1% |
| Asians | 93.4 /100 | #119 | Exceptional 85.1% |
| Immigrants | Southern Europe | 93.3 /100 | #120 | Exceptional 85.1% |
| Immigrants | Egypt | 93.2 /100 | #121 | Exceptional 85.1% |
| Immigrants | Kuwait | 92.6 /100 | #122 | Exceptional 85.1% |
| Armenians | 92.2 /100 | #123 | Exceptional 85.0% |
| Australians | 92.0 /100 | #124 | Exceptional 85.0% |
| Immigrants | Jordan | 91.5 /100 | #125 | Exceptional 85.0% |
| Austrians | 90.9 /100 | #126 | Exceptional 85.0% |
| Slavs | 90.7 /100 | #127 | Exceptional 85.0% |
| Immigrants | Argentina | 90.6 /100 | #128 | Exceptional 85.0% |
| Immigrants | Western Africa | 90.2 /100 | #129 | Exceptional 85.0% |
| Immigrants | Spain | 90.0 /100 | #130 | Exceptional 85.0% |
| Chinese | 89.6 /100 | #131 | Excellent 85.0% |
Demographics Similar to Czechs by In Labor Force | Age 30-34
In terms of in labor force | age 30-34, the demographic groups most similar to Czechs are Russian (85.5%, a difference of 0.0%), Immigrants from Kenya (85.5%, a difference of 0.010%), Immigrants from Turkey (85.5%, a difference of 0.010%), Polish (85.5%, a difference of 0.010%), and Filipino (85.5%, a difference of 0.020%).
| Demographics | Rating | Rank | In Labor Force | Age 30-34 |
| Lithuanians | 99.8 /100 | #49 | Exceptional 85.6% |
| Immigrants | Australia | 99.8 /100 | #50 | Exceptional 85.6% |
| Cape Verdeans | 99.7 /100 | #51 | Exceptional 85.6% |
| Slovenes | 99.7 /100 | #52 | Exceptional 85.6% |
| Filipinos | 99.6 /100 | #53 | Exceptional 85.5% |
| Immigrants | Kenya | 99.6 /100 | #54 | Exceptional 85.5% |
| Immigrants | Turkey | 99.6 /100 | #55 | Exceptional 85.5% |
| Czechs | 99.6 /100 | #56 | Exceptional 85.5% |
| Russians | 99.6 /100 | #57 | Exceptional 85.5% |
| Poles | 99.6 /100 | #58 | Exceptional 85.5% |
| Immigrants | Poland | 99.5 /100 | #59 | Exceptional 85.5% |
| Immigrants | France | 99.5 /100 | #60 | Exceptional 85.5% |
| Immigrants | Brazil | 99.5 /100 | #61 | Exceptional 85.5% |
| Soviet Union | 99.4 /100 | #62 | Exceptional 85.5% |
| Macedonians | 99.4 /100 | #63 | Exceptional 85.5% |