Afghan vs Immigrants from Haiti In Labor Force | Age 20-64
COMPARE
Afghan
Immigrants from Haiti
In Labor Force | Age 20-64
In Labor Force | Age 20-64 Comparison
Afghans
Immigrants from Haiti
80.3%
IN LABOR FORCE | AGE 20-64
98.9/ 100
METRIC RATING
57th/ 347
METRIC RANK
79.4%
IN LABOR FORCE | AGE 20-64
32.1/ 100
METRIC RATING
188th/ 347
METRIC RANK
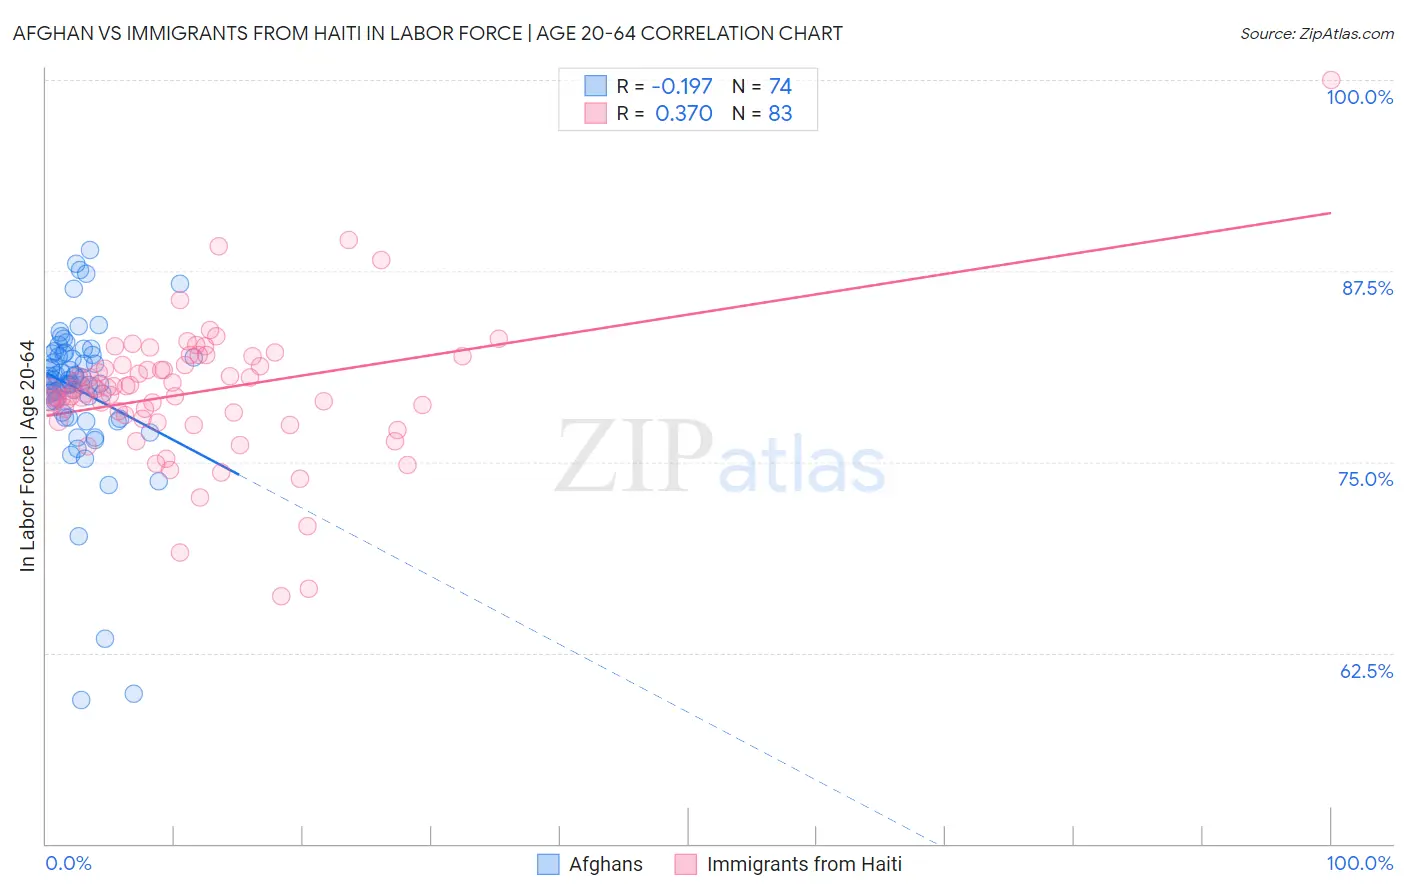
Afghan vs Immigrants from Haiti In Labor Force | Age 20-64 Correlation Chart
The statistical analysis conducted on geographies consisting of 148,874,971 people shows a poor negative correlation between the proportion of Afghans and labor force participation rate among population between the ages 20 and 64 in the United States with a correlation coefficient (R) of -0.197 and weighted average of 80.3%. Similarly, the statistical analysis conducted on geographies consisting of 225,284,201 people shows a mild positive correlation between the proportion of Immigrants from Haiti and labor force participation rate among population between the ages 20 and 64 in the United States with a correlation coefficient (R) of 0.370 and weighted average of 79.4%, a difference of 1.1%.
In Labor Force | Age 20-64 Correlation Summary
| Measurement | Afghan | Immigrants from Haiti |
| Minimum | 59.4% | 66.2% |
| Maximum | 88.9% | 100.0% |
| Range | 29.5% | 33.8% |
| Mean | 79.7% | 79.6% |
| Median | 80.3% | 79.8% |
| Interquartile 25% (IQ1) | 78.3% | 77.8% |
| Interquartile 75% (IQ3) | 82.1% | 81.4% |
| Interquartile Range (IQR) | 3.8% | 3.5% |
| Standard Deviation (Sample) | 5.1% | 4.5% |
| Standard Deviation (Population) | 5.1% | 4.5% |
Similar Demographics by In Labor Force | Age 20-64
Demographics Similar to Afghans by In Labor Force | Age 20-64
In terms of in labor force | age 20-64, the demographic groups most similar to Afghans are Immigrants from Northern Africa (80.3%, a difference of 0.0%), Immigrants from Cabo Verde (80.3%, a difference of 0.010%), Serbian (80.3%, a difference of 0.010%), Swedish (80.3%, a difference of 0.010%), and Tongan (80.3%, a difference of 0.020%).
| Demographics | Rating | Rank | In Labor Force | Age 20-64 |
| Immigrants | Sudan | 99.4 /100 | #50 | Exceptional 80.4% |
| Immigrants | Sri Lanka | 99.3 /100 | #51 | Exceptional 80.4% |
| Turks | 99.2 /100 | #52 | Exceptional 80.3% |
| Immigrants | Peru | 99.2 /100 | #53 | Exceptional 80.3% |
| Peruvians | 99.1 /100 | #54 | Exceptional 80.3% |
| Immigrants | Cabo Verde | 99.0 /100 | #55 | Exceptional 80.3% |
| Immigrants | Northern Africa | 99.0 /100 | #56 | Exceptional 80.3% |
| Afghans | 98.9 /100 | #57 | Exceptional 80.3% |
| Serbians | 98.9 /100 | #58 | Exceptional 80.3% |
| Swedes | 98.9 /100 | #59 | Exceptional 80.3% |
| Tongans | 98.8 /100 | #60 | Exceptional 80.3% |
| Burmese | 98.8 /100 | #61 | Exceptional 80.3% |
| Carpatho Rusyns | 98.8 /100 | #62 | Exceptional 80.3% |
| Immigrants | Korea | 98.8 /100 | #63 | Exceptional 80.3% |
| Immigrants | Albania | 98.7 /100 | #64 | Exceptional 80.3% |
Demographics Similar to Immigrants from Haiti by In Labor Force | Age 20-64
In terms of in labor force | age 20-64, the demographic groups most similar to Immigrants from Haiti are Assyrian/Chaldean/Syriac (79.4%, a difference of 0.010%), Immigrants from El Salvador (79.4%, a difference of 0.010%), Immigrants from Syria (79.4%, a difference of 0.010%), Israeli (79.5%, a difference of 0.020%), and Northern European (79.5%, a difference of 0.020%).
| Demographics | Rating | Rank | In Labor Force | Age 20-64 |
| Immigrants | Saudi Arabia | 37.7 /100 | #181 | Fair 79.5% |
| Malaysians | 37.1 /100 | #182 | Fair 79.5% |
| Immigrants | Hungary | 36.8 /100 | #183 | Fair 79.5% |
| Finns | 35.9 /100 | #184 | Fair 79.5% |
| Israelis | 34.7 /100 | #185 | Fair 79.5% |
| Northern Europeans | 34.5 /100 | #186 | Fair 79.5% |
| Assyrians/Chaldeans/Syriacs | 33.3 /100 | #187 | Fair 79.4% |
| Immigrants | Haiti | 32.1 /100 | #188 | Fair 79.4% |
| Immigrants | El Salvador | 30.9 /100 | #189 | Fair 79.4% |
| Immigrants | Syria | 30.8 /100 | #190 | Fair 79.4% |
| Swiss | 28.9 /100 | #191 | Fair 79.4% |
| Immigrants | Denmark | 26.9 /100 | #192 | Fair 79.4% |
| Indonesians | 26.1 /100 | #193 | Fair 79.4% |
| Immigrants | Thailand | 24.8 /100 | #194 | Fair 79.4% |
| Immigrants | Austria | 23.7 /100 | #195 | Fair 79.4% |