Ukrainian vs Osage Householder Income Under 25 years
COMPARE
Ukrainian
Osage
Householder Income Under 25 years
Householder Income Under 25 years Comparison
Ukrainians
Osage
$53,843
HOUSEHOLDER INCOME UNDER 25 YEARS
98.3/ 100
METRIC RATING
103rd/ 347
METRIC RANK
$45,764
HOUSEHOLDER INCOME UNDER 25 YEARS
0.0/ 100
METRIC RATING
326th/ 347
METRIC RANK
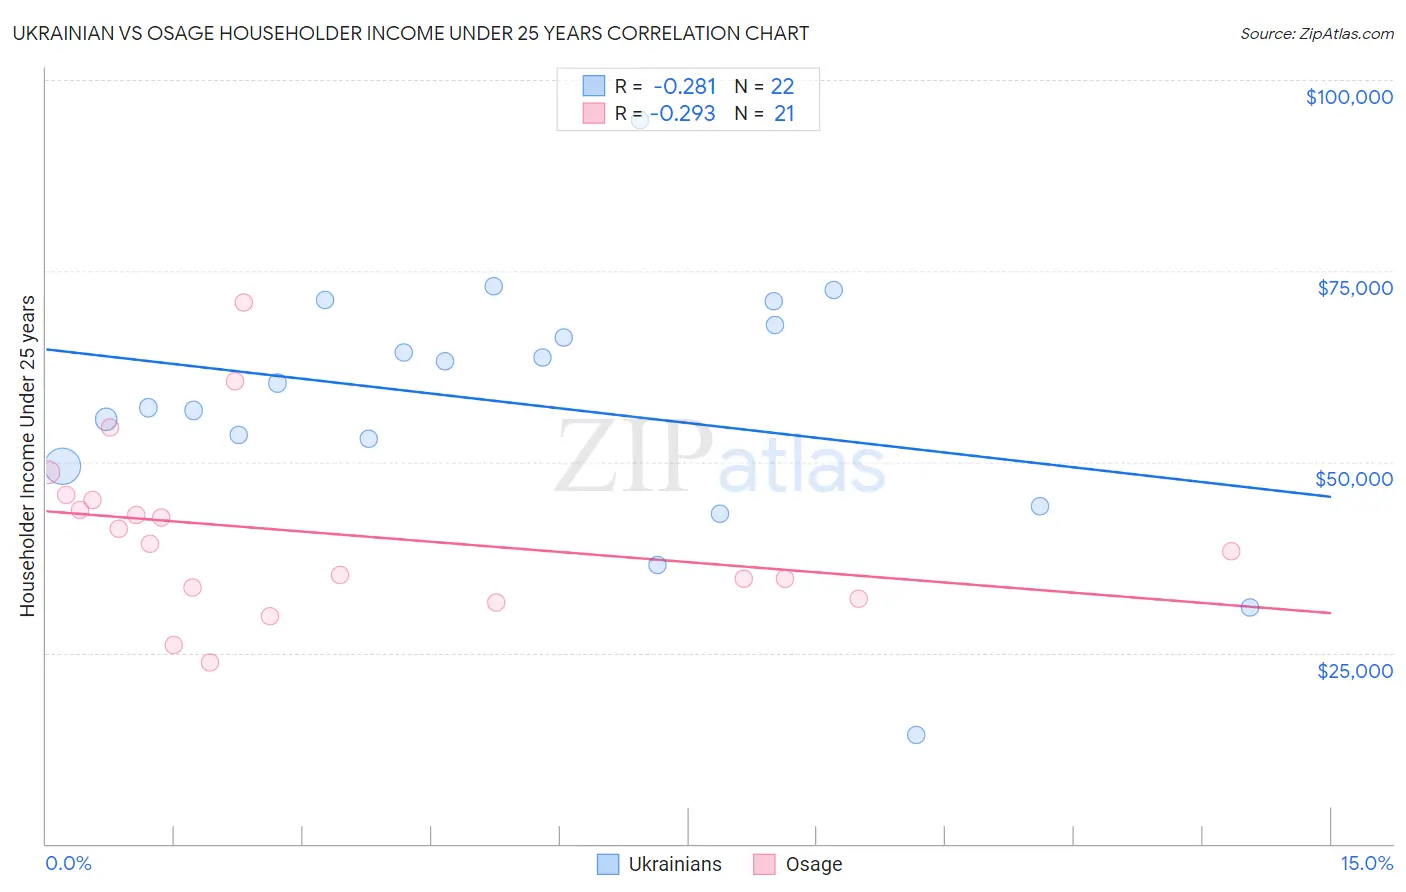
Ukrainian vs Osage Householder Income Under 25 years Correlation Chart
The statistical analysis conducted on geographies consisting of 365,367,408 people shows a weak negative correlation between the proportion of Ukrainians and household income with householder under the age of 25 in the United States with a correlation coefficient (R) of -0.281 and weighted average of $53,843. Similarly, the statistical analysis conducted on geographies consisting of 87,289,691 people shows a weak negative correlation between the proportion of Osage and household income with householder under the age of 25 in the United States with a correlation coefficient (R) of -0.293 and weighted average of $45,764, a difference of 17.6%.
Householder Income Under 25 years Correlation Summary
| Measurement | Ukrainian | Osage |
| Minimum | $14,236 | $23,750 |
| Maximum | $94,821 | $70,795 |
| Range | $80,585 | $47,045 |
| Mean | $57,387 | $40,691 |
| Median | $58,725 | $39,256 |
| Interquartile 25% (IQ1) | $49,424 | $32,844 |
| Interquartile 75% (IQ3) | $67,932 | $45,298 |
| Interquartile Range (IQR) | $18,508 | $12,454 |
| Standard Deviation (Sample) | $16,958 | $11,304 |
| Standard Deviation (Population) | $16,568 | $11,031 |
Similar Demographics by Householder Income Under 25 years
Demographics Similar to Ukrainians by Householder Income Under 25 years
In terms of householder income under 25 years, the demographic groups most similar to Ukrainians are Ethiopian ($53,818, a difference of 0.050%), Immigrants from France ($53,805, a difference of 0.070%), Albanian ($53,794, a difference of 0.090%), Ecuadorian ($53,911, a difference of 0.13%), and South American ($53,939, a difference of 0.18%).
| Demographics | Rating | Rank | Householder Income Under 25 years |
| Argentineans | 99.2 /100 | #96 | Exceptional $54,154 |
| Immigrants | Portugal | 99.1 /100 | #97 | Exceptional $54,105 |
| Eastern Europeans | 99.0 /100 | #98 | Exceptional $54,066 |
| Alaska Natives | 98.8 /100 | #99 | Exceptional $54,000 |
| Immigrants | Kazakhstan | 98.8 /100 | #100 | Exceptional $53,990 |
| South Americans | 98.6 /100 | #101 | Exceptional $53,939 |
| Ecuadorians | 98.5 /100 | #102 | Exceptional $53,911 |
| Ukrainians | 98.3 /100 | #103 | Exceptional $53,843 |
| Ethiopians | 98.2 /100 | #104 | Exceptional $53,818 |
| Immigrants | France | 98.1 /100 | #105 | Exceptional $53,805 |
| Albanians | 98.1 /100 | #106 | Exceptional $53,794 |
| Australians | 97.8 /100 | #107 | Exceptional $53,739 |
| Maltese | 97.8 /100 | #108 | Exceptional $53,735 |
| Immigrants | Ecuador | 97.7 /100 | #109 | Exceptional $53,722 |
| Greeks | 97.7 /100 | #110 | Exceptional $53,715 |
Demographics Similar to Osage by Householder Income Under 25 years
In terms of householder income under 25 years, the demographic groups most similar to Osage are Bahamian ($45,743, a difference of 0.050%), Immigrants from Bahamas ($45,793, a difference of 0.060%), Dutch West Indian ($45,816, a difference of 0.11%), German Russian ($45,673, a difference of 0.20%), and Seminole ($45,649, a difference of 0.25%).
| Demographics | Rating | Rank | Householder Income Under 25 years |
| Africans | 0.0 /100 | #319 | Tragic $46,838 |
| Immigrants | Sudan | 0.0 /100 | #320 | Tragic $46,791 |
| Potawatomi | 0.0 /100 | #321 | Tragic $46,462 |
| Sioux | 0.0 /100 | #322 | Tragic $46,417 |
| Immigrants | Saudi Arabia | 0.0 /100 | #323 | Tragic $46,187 |
| Dutch West Indians | 0.0 /100 | #324 | Tragic $45,816 |
| Immigrants | Bahamas | 0.0 /100 | #325 | Tragic $45,793 |
| Osage | 0.0 /100 | #326 | Tragic $45,764 |
| Bahamians | 0.0 /100 | #327 | Tragic $45,743 |
| German Russians | 0.0 /100 | #328 | Tragic $45,673 |
| Seminole | 0.0 /100 | #329 | Tragic $45,649 |
| Indonesians | 0.0 /100 | #330 | Tragic $45,566 |
| Immigrants | Zaire | 0.0 /100 | #331 | Tragic $45,529 |
| Choctaw | 0.0 /100 | #332 | Tragic $45,450 |
| Creek | 0.0 /100 | #333 | Tragic $45,371 |