Spanish American Indian vs Osage Householder Income Under 25 years
COMPARE
Spanish American Indian
Osage
Householder Income Under 25 years
Householder Income Under 25 years Comparison
Spanish American Indians
Osage
$55,573
HOUSEHOLDER INCOME UNDER 25 YEARS
100.0/ 100
METRIC RATING
45th/ 347
METRIC RANK
$45,764
HOUSEHOLDER INCOME UNDER 25 YEARS
0.0/ 100
METRIC RATING
326th/ 347
METRIC RANK
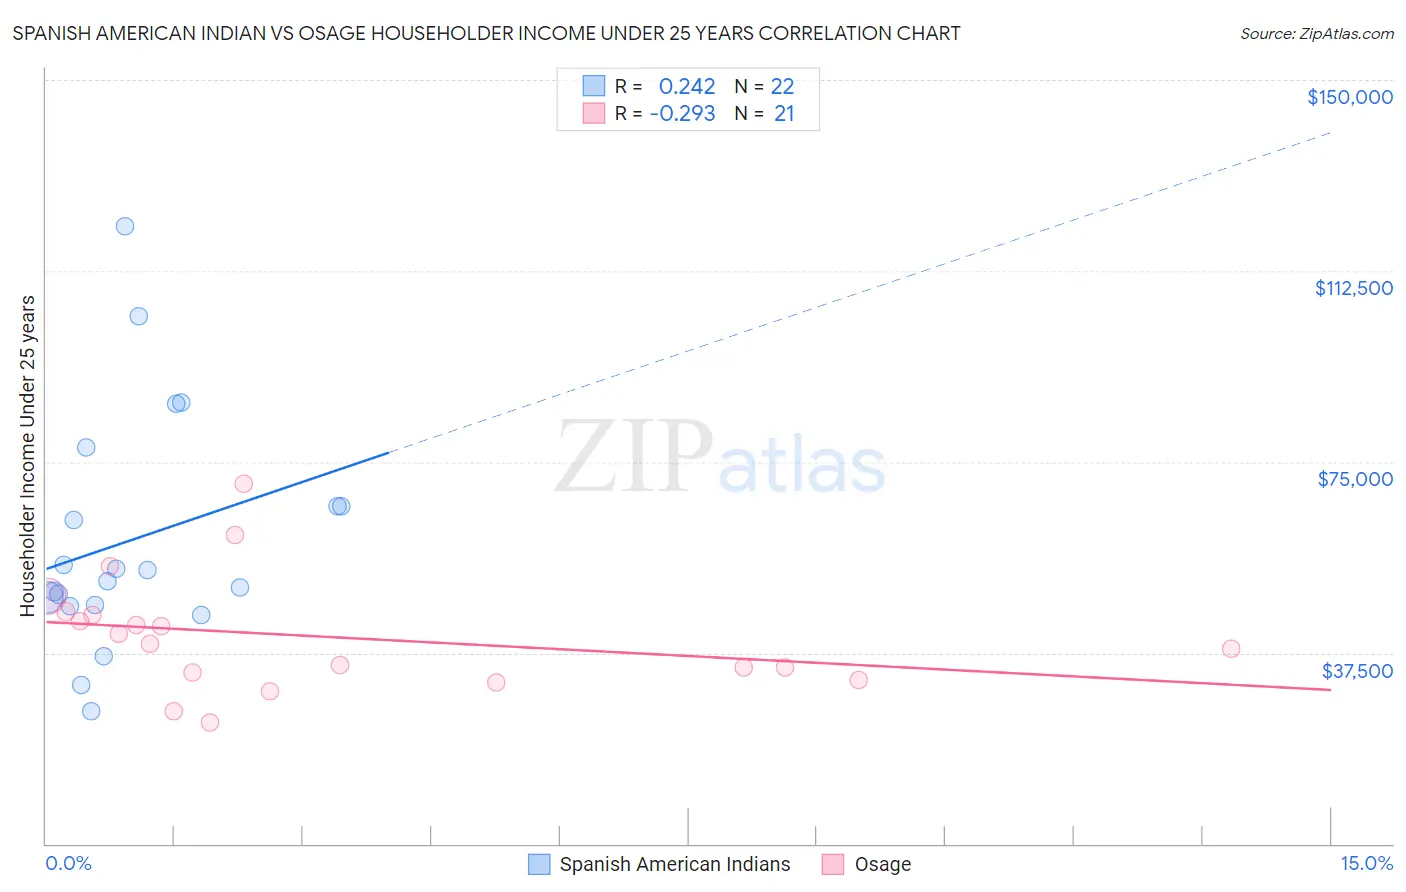
Spanish American Indian vs Osage Householder Income Under 25 years Correlation Chart
The statistical analysis conducted on geographies consisting of 69,838,051 people shows a weak positive correlation between the proportion of Spanish American Indians and household income with householder under the age of 25 in the United States with a correlation coefficient (R) of 0.242 and weighted average of $55,573. Similarly, the statistical analysis conducted on geographies consisting of 87,289,691 people shows a weak negative correlation between the proportion of Osage and household income with householder under the age of 25 in the United States with a correlation coefficient (R) of -0.293 and weighted average of $45,764, a difference of 21.4%.
Householder Income Under 25 years Correlation Summary
| Measurement | Spanish American Indian | Osage |
| Minimum | $26,095 | $23,750 |
| Maximum | $121,305 | $70,795 |
| Range | $95,210 | $47,045 |
| Mean | $59,799 | $40,691 |
| Median | $52,673 | $39,256 |
| Interquartile 25% (IQ1) | $46,974 | $32,844 |
| Interquartile 75% (IQ3) | $66,250 | $45,298 |
| Interquartile Range (IQR) | $19,276 | $12,454 |
| Standard Deviation (Sample) | $23,098 | $11,304 |
| Standard Deviation (Population) | $22,567 | $11,031 |
Similar Demographics by Householder Income Under 25 years
Demographics Similar to Spanish American Indians by Householder Income Under 25 years
In terms of householder income under 25 years, the demographic groups most similar to Spanish American Indians are Immigrants from Eastern Europe ($55,572, a difference of 0.0%), Cambodian ($55,571, a difference of 0.0%), Immigrants from Vietnam ($55,562, a difference of 0.020%), Iranian ($55,548, a difference of 0.040%), and Puget Sound Salish ($55,543, a difference of 0.050%).
| Demographics | Rating | Rank | Householder Income Under 25 years |
| Immigrants | Iran | 100.0 /100 | #38 | Exceptional $55,880 |
| Immigrants | Belarus | 100.0 /100 | #39 | Exceptional $55,743 |
| Immigrants | Greece | 100.0 /100 | #40 | Exceptional $55,727 |
| Immigrants | Guyana | 100.0 /100 | #41 | Exceptional $55,726 |
| Immigrants | Korea | 100.0 /100 | #42 | Exceptional $55,716 |
| Immigrants | South Eastern Asia | 100.0 /100 | #43 | Exceptional $55,714 |
| Paraguayans | 100.0 /100 | #44 | Exceptional $55,614 |
| Spanish American Indians | 100.0 /100 | #45 | Exceptional $55,573 |
| Immigrants | Eastern Europe | 100.0 /100 | #46 | Exceptional $55,572 |
| Cambodians | 100.0 /100 | #47 | Exceptional $55,571 |
| Immigrants | Vietnam | 100.0 /100 | #48 | Exceptional $55,562 |
| Iranians | 100.0 /100 | #49 | Exceptional $55,548 |
| Puget Sound Salish | 100.0 /100 | #50 | Exceptional $55,543 |
| Immigrants | Romania | 100.0 /100 | #51 | Exceptional $55,522 |
| Immigrants | Indonesia | 100.0 /100 | #52 | Exceptional $55,521 |
Demographics Similar to Osage by Householder Income Under 25 years
In terms of householder income under 25 years, the demographic groups most similar to Osage are Bahamian ($45,743, a difference of 0.050%), Immigrants from Bahamas ($45,793, a difference of 0.060%), Dutch West Indian ($45,816, a difference of 0.11%), German Russian ($45,673, a difference of 0.20%), and Seminole ($45,649, a difference of 0.25%).
| Demographics | Rating | Rank | Householder Income Under 25 years |
| Africans | 0.0 /100 | #319 | Tragic $46,838 |
| Immigrants | Sudan | 0.0 /100 | #320 | Tragic $46,791 |
| Potawatomi | 0.0 /100 | #321 | Tragic $46,462 |
| Sioux | 0.0 /100 | #322 | Tragic $46,417 |
| Immigrants | Saudi Arabia | 0.0 /100 | #323 | Tragic $46,187 |
| Dutch West Indians | 0.0 /100 | #324 | Tragic $45,816 |
| Immigrants | Bahamas | 0.0 /100 | #325 | Tragic $45,793 |
| Osage | 0.0 /100 | #326 | Tragic $45,764 |
| Bahamians | 0.0 /100 | #327 | Tragic $45,743 |
| German Russians | 0.0 /100 | #328 | Tragic $45,673 |
| Seminole | 0.0 /100 | #329 | Tragic $45,649 |
| Indonesians | 0.0 /100 | #330 | Tragic $45,566 |
| Immigrants | Zaire | 0.0 /100 | #331 | Tragic $45,529 |
| Choctaw | 0.0 /100 | #332 | Tragic $45,450 |
| Creek | 0.0 /100 | #333 | Tragic $45,371 |