South American vs Immigrants from Eastern Africa Per Capita Income
COMPARE
South American
Immigrants from Eastern Africa
Per Capita Income
Per Capita Income Comparison
South Americans
Immigrants from Eastern Africa
$44,114
PER CAPITA INCOME
62.4/ 100
METRIC RATING
159th/ 347
METRIC RANK
$43,838
PER CAPITA INCOME
54.9/ 100
METRIC RATING
171st/ 347
METRIC RANK
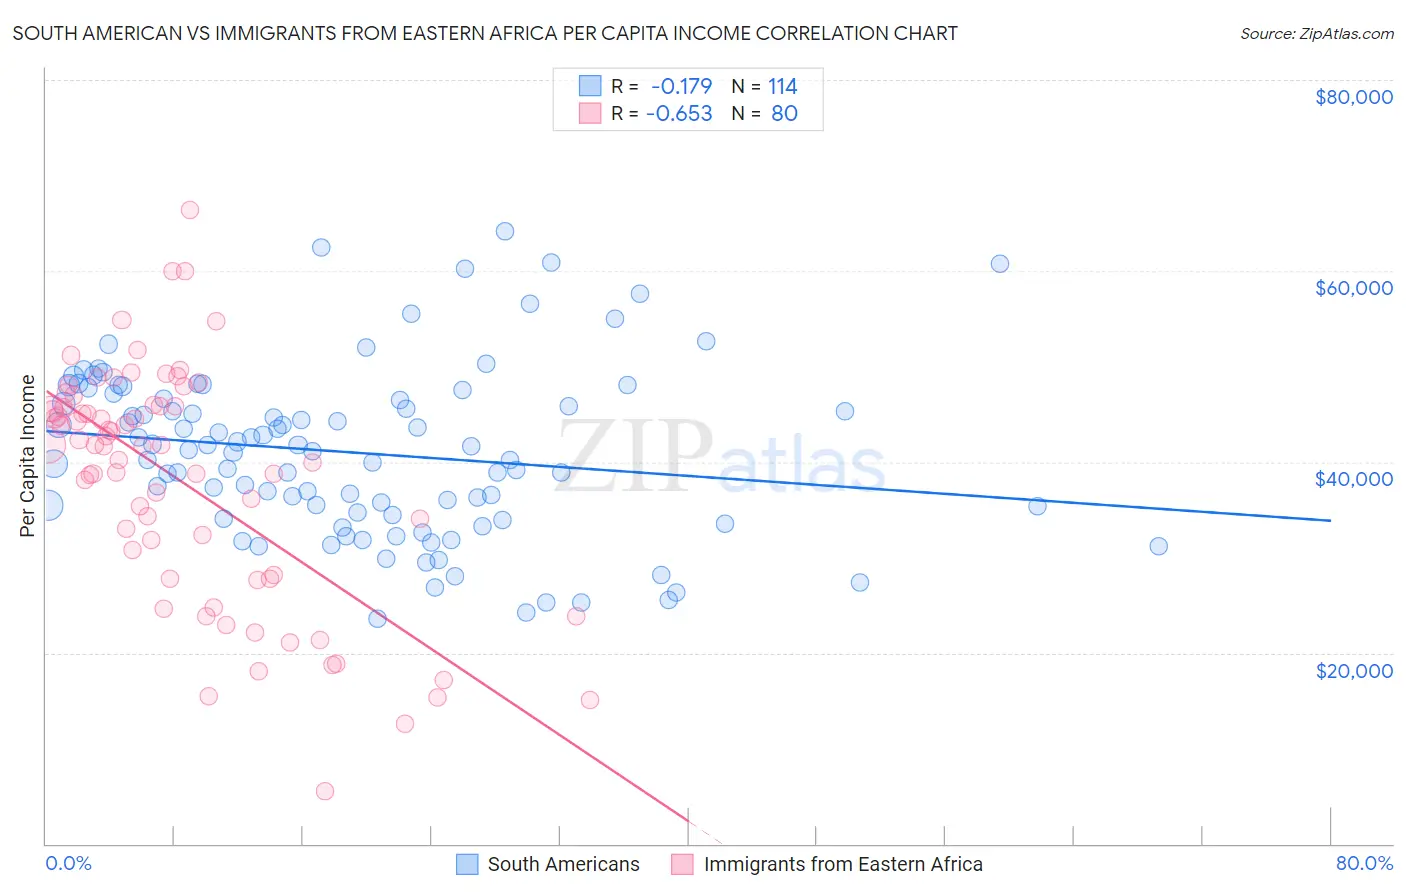
South American vs Immigrants from Eastern Africa Per Capita Income Correlation Chart
The statistical analysis conducted on geographies consisting of 494,145,698 people shows a poor negative correlation between the proportion of South Americans and per capita income in the United States with a correlation coefficient (R) of -0.179 and weighted average of $44,114. Similarly, the statistical analysis conducted on geographies consisting of 355,180,716 people shows a significant negative correlation between the proportion of Immigrants from Eastern Africa and per capita income in the United States with a correlation coefficient (R) of -0.653 and weighted average of $43,838, a difference of 0.63%.
Per Capita Income Correlation Summary
| Measurement | South American | Immigrants from Eastern Africa |
| Minimum | $23,579 | $5,516 |
| Maximum | $64,213 | $66,352 |
| Range | $40,635 | $60,836 |
| Mean | $40,955 | $37,946 |
| Median | $41,221 | $41,723 |
| Interquartile 25% (IQ1) | $34,406 | $27,967 |
| Interquartile 75% (IQ3) | $46,619 | $45,811 |
| Interquartile Range (IQR) | $12,213 | $17,844 |
| Standard Deviation (Sample) | $8,864 | $12,344 |
| Standard Deviation (Population) | $8,825 | $12,266 |
Demographics Similar to South Americans and Immigrants from Eastern Africa by Per Capita Income
In terms of per capita income, the demographic groups most similar to South Americans are Danish ($44,095, a difference of 0.040%), Costa Rican ($44,090, a difference of 0.050%), Swiss ($44,076, a difference of 0.090%), Immigrants from South America ($44,068, a difference of 0.10%), and Immigrants from Nepal ($44,187, a difference of 0.17%). Similarly, the demographic groups most similar to Immigrants from Eastern Africa are Scandinavian ($43,848, a difference of 0.020%), Immigrants from Peru ($43,852, a difference of 0.030%), Czechoslovakian ($43,806, a difference of 0.070%), Belgian ($43,951, a difference of 0.26%), and English ($43,982, a difference of 0.33%).
| Demographics | Rating | Rank | Per Capita Income |
| Uruguayans | 67.6 /100 | #155 | Good $44,318 |
| Slovaks | 65.4 /100 | #156 | Good $44,229 |
| South American Indians | 64.8 /100 | #157 | Good $44,206 |
| Immigrants | Nepal | 64.3 /100 | #158 | Good $44,187 |
| South Americans | 62.4 /100 | #159 | Good $44,114 |
| Danes | 61.9 /100 | #160 | Good $44,095 |
| Costa Ricans | 61.8 /100 | #161 | Good $44,090 |
| Swiss | 61.4 /100 | #162 | Good $44,076 |
| Immigrants | South America | 61.2 /100 | #163 | Good $44,068 |
| Sri Lankans | 59.8 /100 | #164 | Average $44,014 |
| Immigrants | Philippines | 59.4 /100 | #165 | Average $44,000 |
| Immigrants | Uruguay | 59.3 /100 | #166 | Average $43,997 |
| English | 58.9 /100 | #167 | Average $43,982 |
| Belgians | 58.1 /100 | #168 | Average $43,951 |
| Immigrants | Peru | 55.3 /100 | #169 | Average $43,852 |
| Scandinavians | 55.2 /100 | #170 | Average $43,848 |
| Immigrants | Eastern Africa | 54.9 /100 | #171 | Average $43,838 |
| Czechoslovakians | 54.1 /100 | #172 | Average $43,806 |
| French | 50.7 /100 | #173 | Average $43,685 |
| Colombians | 50.0 /100 | #174 | Average $43,661 |
| Celtics | 48.9 /100 | #175 | Average $43,621 |