Samoan vs Guatemalan Median Family Income
COMPARE
Samoan
Guatemalan
Median Family Income
Median Family Income Comparison
Samoans
Guatemalans
$100,344
MEDIAN FAMILY INCOME
23.3/ 100
METRIC RATING
196th/ 347
METRIC RANK
$88,295
MEDIAN FAMILY INCOME
0.1/ 100
METRIC RATING
285th/ 347
METRIC RANK
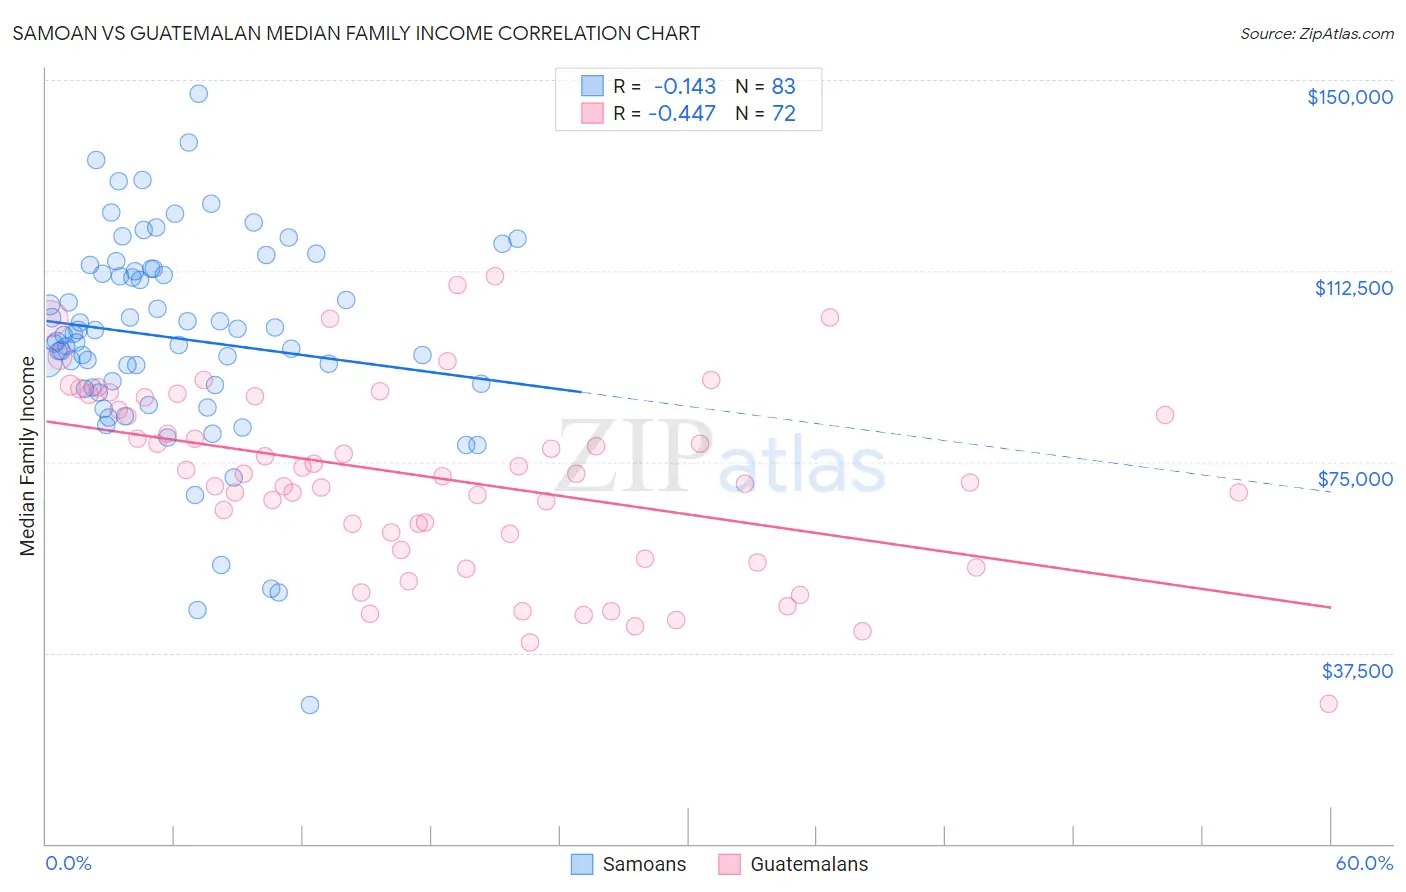
Samoan vs Guatemalan Median Family Income Correlation Chart
The statistical analysis conducted on geographies consisting of 225,048,976 people shows a poor negative correlation between the proportion of Samoans and median family income in the United States with a correlation coefficient (R) of -0.143 and weighted average of $100,344. Similarly, the statistical analysis conducted on geographies consisting of 409,160,818 people shows a moderate negative correlation between the proportion of Guatemalans and median family income in the United States with a correlation coefficient (R) of -0.447 and weighted average of $88,295, a difference of 13.7%.
Median Family Income Correlation Summary
| Measurement | Samoan | Guatemalan |
| Minimum | $27,294 | $27,406 |
| Maximum | $147,200 | $111,362 |
| Range | $119,906 | $83,956 |
| Mean | $99,252 | $71,713 |
| Median | $99,920 | $72,451 |
| Interquartile 25% (IQ1) | $89,665 | $59,369 |
| Interquartile 75% (IQ3) | $112,813 | $86,431 |
| Interquartile Range (IQR) | $23,148 | $27,062 |
| Standard Deviation (Sample) | $20,629 | $18,247 |
| Standard Deviation (Population) | $20,504 | $18,120 |
Similar Demographics by Median Family Income
Demographics Similar to Samoans by Median Family Income
In terms of median family income, the demographic groups most similar to Samoans are Immigrants from Cameroon ($100,289, a difference of 0.060%), Immigrants from South America ($100,414, a difference of 0.070%), Immigrants from Africa ($100,256, a difference of 0.090%), Yugoslavian ($100,119, a difference of 0.22%), and Iraqi ($100,658, a difference of 0.31%).
| Demographics | Rating | Rank | Median Family Income |
| Immigrants | Portugal | 29.6 /100 | #189 | Fair $100,984 |
| Immigrants | Immigrants | 29.4 /100 | #190 | Fair $100,962 |
| Colombians | 27.2 /100 | #191 | Fair $100,750 |
| Immigrants | Kenya | 26.5 /100 | #192 | Fair $100,679 |
| Iraqis | 26.3 /100 | #193 | Fair $100,658 |
| Uruguayans | 26.3 /100 | #194 | Fair $100,656 |
| Immigrants | South America | 23.9 /100 | #195 | Fair $100,414 |
| Samoans | 23.3 /100 | #196 | Fair $100,344 |
| Immigrants | Cameroon | 22.8 /100 | #197 | Fair $100,289 |
| Immigrants | Africa | 22.5 /100 | #198 | Fair $100,256 |
| Yugoslavians | 21.3 /100 | #199 | Fair $100,119 |
| Spanish | 20.1 /100 | #200 | Fair $99,977 |
| Immigrants | Thailand | 19.0 /100 | #201 | Poor $99,840 |
| Whites/Caucasians | 18.7 /100 | #202 | Poor $99,800 |
| Scotch-Irish | 17.1 /100 | #203 | Poor $99,591 |
Demographics Similar to Guatemalans by Median Family Income
In terms of median family income, the demographic groups most similar to Guatemalans are Indonesian ($88,301, a difference of 0.010%), Immigrants from Nicaragua ($88,267, a difference of 0.030%), Potawatomi ($88,265, a difference of 0.030%), Bangladeshi ($88,358, a difference of 0.070%), and Cherokee ($88,209, a difference of 0.10%).
| Demographics | Rating | Rank | Median Family Income |
| Immigrants | Grenada | 0.1 /100 | #278 | Tragic $89,249 |
| Immigrants | Belize | 0.1 /100 | #279 | Tragic $89,197 |
| British West Indians | 0.1 /100 | #280 | Tragic $88,987 |
| Blackfeet | 0.1 /100 | #281 | Tragic $88,717 |
| Comanche | 0.1 /100 | #282 | Tragic $88,556 |
| Bangladeshis | 0.1 /100 | #283 | Tragic $88,358 |
| Indonesians | 0.1 /100 | #284 | Tragic $88,301 |
| Guatemalans | 0.1 /100 | #285 | Tragic $88,295 |
| Immigrants | Nicaragua | 0.1 /100 | #286 | Tragic $88,267 |
| Potawatomi | 0.1 /100 | #287 | Tragic $88,265 |
| Cherokee | 0.1 /100 | #288 | Tragic $88,209 |
| Central American Indians | 0.1 /100 | #289 | Tragic $88,034 |
| Shoshone | 0.1 /100 | #290 | Tragic $87,872 |
| Immigrants | Cabo Verde | 0.1 /100 | #291 | Tragic $87,830 |
| Africans | 0.1 /100 | #292 | Tragic $87,820 |