Pakistani vs Austrian Householder Income Under 25 years
COMPARE
Pakistani
Austrian
Householder Income Under 25 years
Householder Income Under 25 years Comparison
Pakistanis
Austrians
$53,325
HOUSEHOLDER INCOME UNDER 25 YEARS
94.1/ 100
METRIC RATING
125th/ 347
METRIC RANK
$51,898
HOUSEHOLDER INCOME UNDER 25 YEARS
32.9/ 100
METRIC RATING
176th/ 347
METRIC RANK
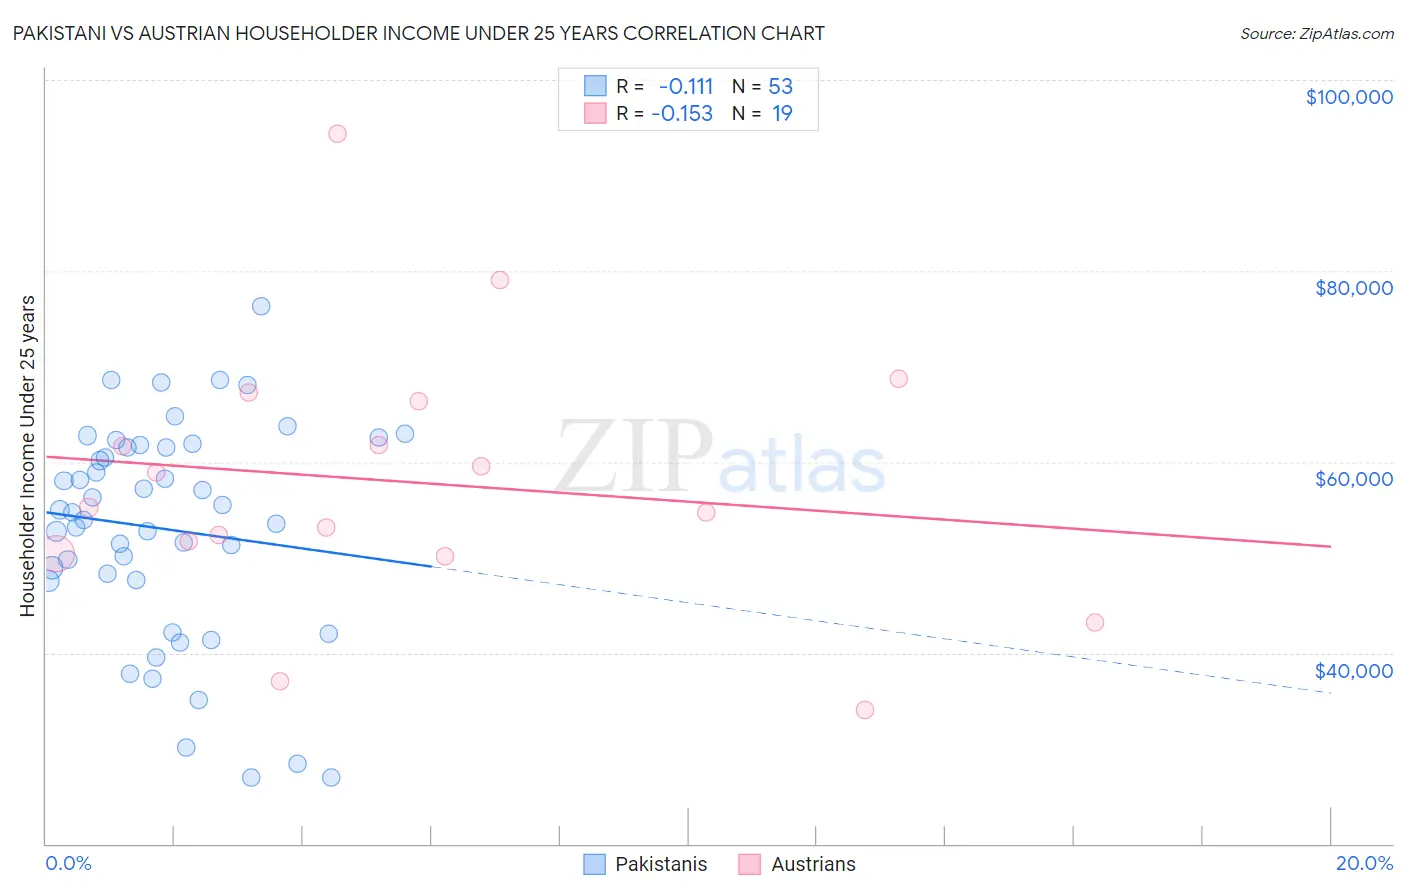
Pakistani vs Austrian Householder Income Under 25 years Correlation Chart
The statistical analysis conducted on geographies consisting of 292,497,828 people shows a poor negative correlation between the proportion of Pakistanis and household income with householder under the age of 25 in the United States with a correlation coefficient (R) of -0.111 and weighted average of $53,325. Similarly, the statistical analysis conducted on geographies consisting of 369,592,006 people shows a poor negative correlation between the proportion of Austrians and household income with householder under the age of 25 in the United States with a correlation coefficient (R) of -0.153 and weighted average of $51,898, a difference of 2.8%.
Householder Income Under 25 years Correlation Summary
| Measurement | Pakistani | Austrian |
| Minimum | $27,000 | $34,032 |
| Maximum | $76,250 | $94,327 |
| Range | $49,250 | $60,295 |
| Mean | $52,946 | $57,859 |
| Median | $54,698 | $55,270 |
| Interquartile 25% (IQ1) | $47,535 | $50,321 |
| Interquartile 75% (IQ3) | $61,638 | $66,411 |
| Interquartile Range (IQR) | $14,104 | $16,090 |
| Standard Deviation (Sample) | $11,430 | $14,007 |
| Standard Deviation (Population) | $11,322 | $13,634 |
Similar Demographics by Householder Income Under 25 years
Demographics Similar to Pakistanis by Householder Income Under 25 years
In terms of householder income under 25 years, the demographic groups most similar to Pakistanis are Immigrants from Serbia ($53,321, a difference of 0.010%), Immigrants from North America ($53,307, a difference of 0.030%), Immigrants from Bulgaria ($53,305, a difference of 0.040%), Colombian ($53,357, a difference of 0.060%), and New Zealander ($53,294, a difference of 0.060%).
| Demographics | Rating | Rank | Householder Income Under 25 years |
| Immigrants | Switzerland | 96.3 /100 | #118 | Exceptional $53,528 |
| Italians | 95.4 /100 | #119 | Exceptional $53,426 |
| Guamanians/Chamorros | 95.3 /100 | #120 | Exceptional $53,423 |
| Immigrants | Canada | 95.2 /100 | #121 | Exceptional $53,411 |
| Immigrants | Ethiopia | 95.2 /100 | #122 | Exceptional $53,408 |
| Immigrants | Iraq | 94.9 /100 | #123 | Exceptional $53,384 |
| Colombians | 94.6 /100 | #124 | Exceptional $53,357 |
| Pakistanis | 94.1 /100 | #125 | Exceptional $53,325 |
| Immigrants | Serbia | 94.1 /100 | #126 | Exceptional $53,321 |
| Immigrants | North America | 93.9 /100 | #127 | Exceptional $53,307 |
| Immigrants | Bulgaria | 93.9 /100 | #128 | Exceptional $53,305 |
| New Zealanders | 93.7 /100 | #129 | Exceptional $53,294 |
| Nicaraguans | 93.4 /100 | #130 | Exceptional $53,275 |
| Immigrants | Nicaragua | 93.3 /100 | #131 | Exceptional $53,266 |
| Moroccans | 93.1 /100 | #132 | Exceptional $53,256 |
Demographics Similar to Austrians by Householder Income Under 25 years
In terms of householder income under 25 years, the demographic groups most similar to Austrians are Immigrants from Zimbabwe ($51,914, a difference of 0.030%), British West Indian ($51,844, a difference of 0.10%), Finnish ($51,827, a difference of 0.14%), Basque ($51,818, a difference of 0.15%), and Immigrants from England ($51,817, a difference of 0.16%).
| Demographics | Rating | Rank | Householder Income Under 25 years |
| Canadians | 58.8 /100 | #169 | Average $52,336 |
| Israelis | 58.8 /100 | #170 | Average $52,335 |
| Immigrants | Uruguay | 56.8 /100 | #171 | Average $52,302 |
| Cypriots | 51.2 /100 | #172 | Average $52,209 |
| Barbadians | 50.8 /100 | #173 | Average $52,202 |
| Immigrants | Western Asia | 50.0 /100 | #174 | Average $52,190 |
| Immigrants | Zimbabwe | 33.8 /100 | #175 | Fair $51,914 |
| Austrians | 32.9 /100 | #176 | Fair $51,898 |
| British West Indians | 30.0 /100 | #177 | Fair $51,844 |
| Finns | 29.2 /100 | #178 | Fair $51,827 |
| Basques | 28.7 /100 | #179 | Fair $51,818 |
| Immigrants | England | 28.7 /100 | #180 | Fair $51,817 |
| Europeans | 27.6 /100 | #181 | Fair $51,796 |
| Jordanians | 27.6 /100 | #182 | Fair $51,796 |
| Mexican American Indians | 27.0 /100 | #183 | Fair $51,783 |