Immigrants from Spain vs Austrian Householder Income Under 25 years
COMPARE
Immigrants from Spain
Austrian
Householder Income Under 25 years
Householder Income Under 25 years Comparison
Immigrants from Spain
Austrians
$53,560
HOUSEHOLDER INCOME UNDER 25 YEARS
96.6/ 100
METRIC RATING
116th/ 347
METRIC RANK
$51,898
HOUSEHOLDER INCOME UNDER 25 YEARS
32.9/ 100
METRIC RATING
176th/ 347
METRIC RANK
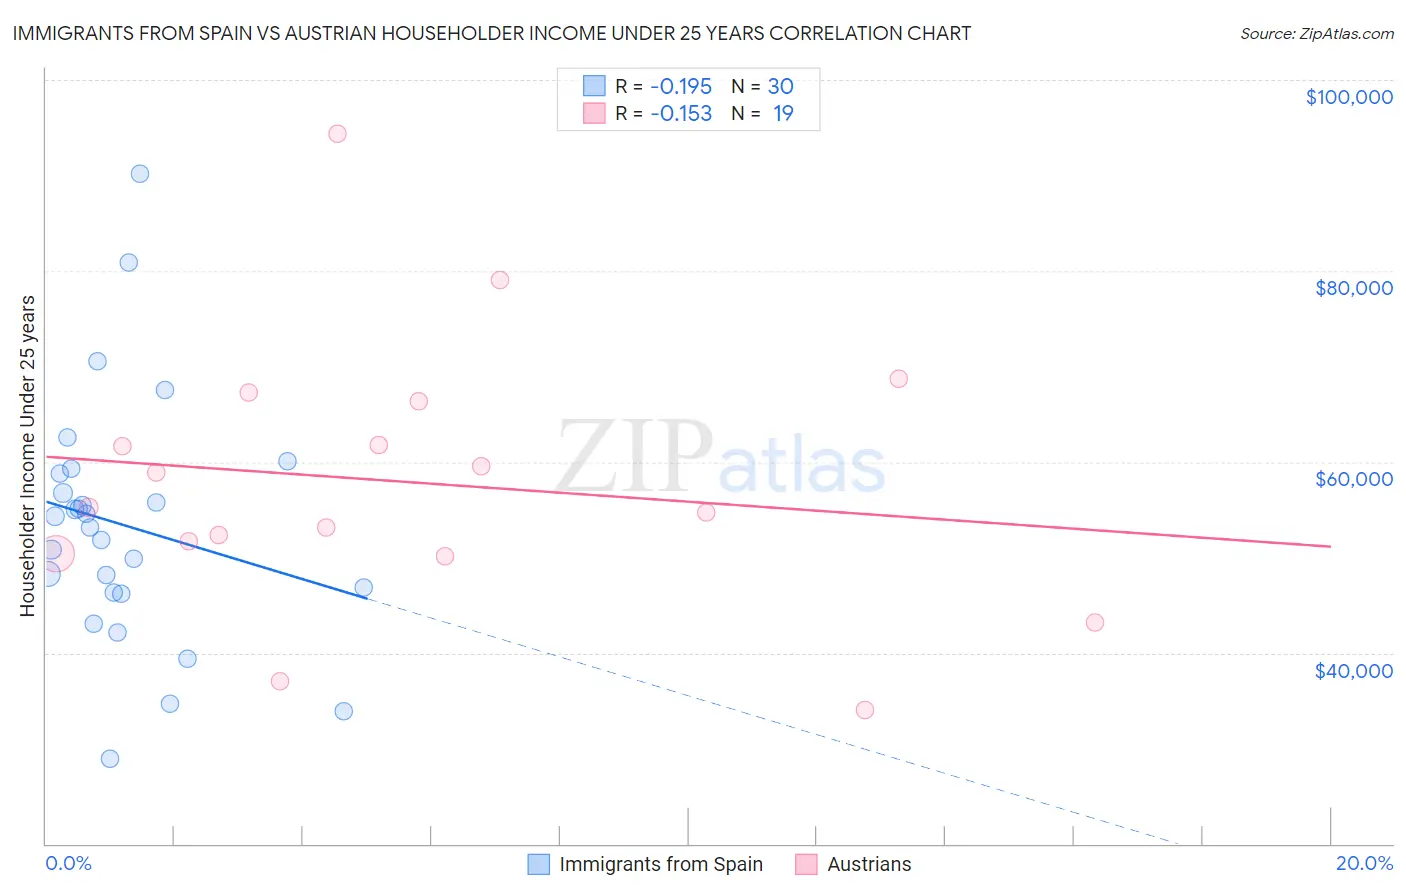
Immigrants from Spain vs Austrian Householder Income Under 25 years Correlation Chart
The statistical analysis conducted on geographies consisting of 211,257,339 people shows a poor negative correlation between the proportion of Immigrants from Spain and household income with householder under the age of 25 in the United States with a correlation coefficient (R) of -0.195 and weighted average of $53,560. Similarly, the statistical analysis conducted on geographies consisting of 369,592,006 people shows a poor negative correlation between the proportion of Austrians and household income with householder under the age of 25 in the United States with a correlation coefficient (R) of -0.153 and weighted average of $51,898, a difference of 3.2%.
Householder Income Under 25 years Correlation Summary
| Measurement | Immigrants from Spain | Austrian |
| Minimum | $28,867 | $34,032 |
| Maximum | $90,189 | $94,327 |
| Range | $61,321 | $60,295 |
| Mean | $53,328 | $57,859 |
| Median | $53,693 | $55,270 |
| Interquartile 25% (IQ1) | $46,321 | $50,321 |
| Interquartile 75% (IQ3) | $58,743 | $66,411 |
| Interquartile Range (IQR) | $12,422 | $16,090 |
| Standard Deviation (Sample) | $12,878 | $14,007 |
| Standard Deviation (Population) | $12,662 | $13,634 |
Similar Demographics by Householder Income Under 25 years
Demographics Similar to Immigrants from Spain by Householder Income Under 25 years
In terms of householder income under 25 years, the demographic groups most similar to Immigrants from Spain are Lithuanian ($53,552, a difference of 0.010%), Immigrants from Switzerland ($53,528, a difference of 0.060%), Immigrants from Albania ($53,597, a difference of 0.070%), Immigrants from Sweden ($53,621, a difference of 0.11%), and Romanian ($53,632, a difference of 0.14%).
| Demographics | Rating | Rank | Householder Income Under 25 years |
| Immigrants | Ecuador | 97.7 /100 | #109 | Exceptional $53,722 |
| Greeks | 97.7 /100 | #110 | Exceptional $53,715 |
| Immigrants | Colombia | 97.7 /100 | #111 | Exceptional $53,714 |
| Immigrants | Oceania | 97.5 /100 | #112 | Exceptional $53,680 |
| Romanians | 97.2 /100 | #113 | Exceptional $53,632 |
| Immigrants | Sweden | 97.1 /100 | #114 | Exceptional $53,621 |
| Immigrants | Albania | 96.9 /100 | #115 | Exceptional $53,597 |
| Immigrants | Spain | 96.6 /100 | #116 | Exceptional $53,560 |
| Lithuanians | 96.6 /100 | #117 | Exceptional $53,552 |
| Immigrants | Switzerland | 96.3 /100 | #118 | Exceptional $53,528 |
| Italians | 95.4 /100 | #119 | Exceptional $53,426 |
| Guamanians/Chamorros | 95.3 /100 | #120 | Exceptional $53,423 |
| Immigrants | Canada | 95.2 /100 | #121 | Exceptional $53,411 |
| Immigrants | Ethiopia | 95.2 /100 | #122 | Exceptional $53,408 |
| Immigrants | Iraq | 94.9 /100 | #123 | Exceptional $53,384 |
Demographics Similar to Austrians by Householder Income Under 25 years
In terms of householder income under 25 years, the demographic groups most similar to Austrians are Immigrants from Zimbabwe ($51,914, a difference of 0.030%), British West Indian ($51,844, a difference of 0.10%), Finnish ($51,827, a difference of 0.14%), Basque ($51,818, a difference of 0.15%), and Immigrants from England ($51,817, a difference of 0.16%).
| Demographics | Rating | Rank | Householder Income Under 25 years |
| Canadians | 58.8 /100 | #169 | Average $52,336 |
| Israelis | 58.8 /100 | #170 | Average $52,335 |
| Immigrants | Uruguay | 56.8 /100 | #171 | Average $52,302 |
| Cypriots | 51.2 /100 | #172 | Average $52,209 |
| Barbadians | 50.8 /100 | #173 | Average $52,202 |
| Immigrants | Western Asia | 50.0 /100 | #174 | Average $52,190 |
| Immigrants | Zimbabwe | 33.8 /100 | #175 | Fair $51,914 |
| Austrians | 32.9 /100 | #176 | Fair $51,898 |
| British West Indians | 30.0 /100 | #177 | Fair $51,844 |
| Finns | 29.2 /100 | #178 | Fair $51,827 |
| Basques | 28.7 /100 | #179 | Fair $51,818 |
| Immigrants | England | 28.7 /100 | #180 | Fair $51,817 |
| Europeans | 27.6 /100 | #181 | Fair $51,796 |
| Jordanians | 27.6 /100 | #182 | Fair $51,796 |
| Mexican American Indians | 27.0 /100 | #183 | Fair $51,783 |