Navajo vs Immigrants from Philippines Median Male Earnings
COMPARE
Navajo
Immigrants from Philippines
Median Male Earnings
Median Male Earnings Comparison
Navajo
Immigrants from Philippines
$42,098
MEDIAN MALE EARNINGS
0.0/ 100
METRIC RATING
340th/ 347
METRIC RANK
$55,809
MEDIAN MALE EARNINGS
78.4/ 100
METRIC RATING
147th/ 347
METRIC RANK
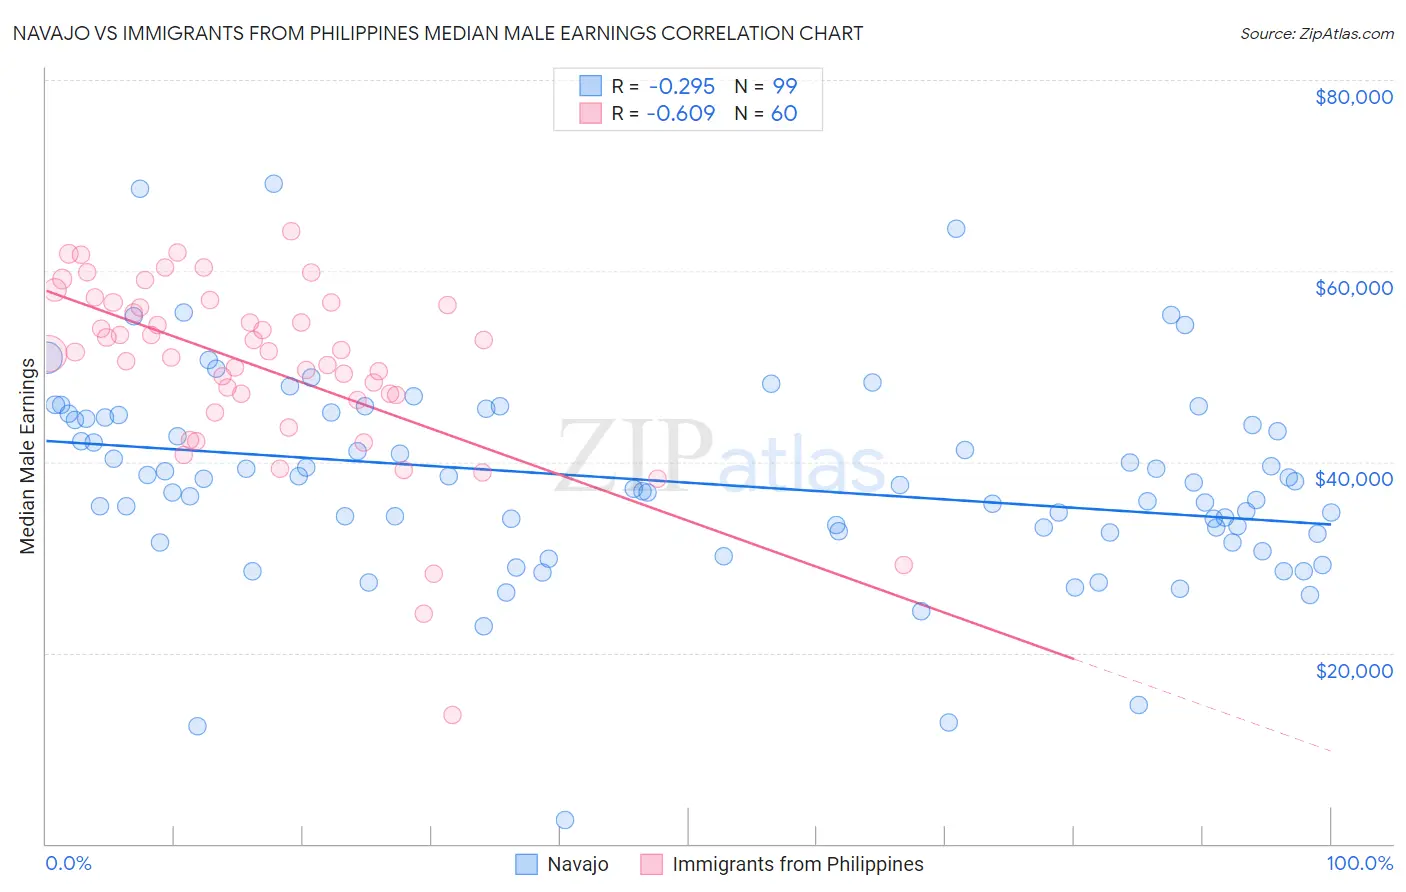
Navajo vs Immigrants from Philippines Median Male Earnings Correlation Chart
The statistical analysis conducted on geographies consisting of 224,788,234 people shows a weak negative correlation between the proportion of Navajo and median male earnings in the United States with a correlation coefficient (R) of -0.295 and weighted average of $42,098. Similarly, the statistical analysis conducted on geographies consisting of 471,105,700 people shows a significant negative correlation between the proportion of Immigrants from Philippines and median male earnings in the United States with a correlation coefficient (R) of -0.609 and weighted average of $55,809, a difference of 32.6%.
Median Male Earnings Correlation Summary
| Measurement | Navajo | Immigrants from Philippines |
| Minimum | $2,499 | $13,438 |
| Maximum | $69,181 | $64,188 |
| Range | $66,682 | $50,750 |
| Mean | $37,941 | $49,896 |
| Median | $37,586 | $51,541 |
| Interquartile 25% (IQ1) | $32,558 | $46,774 |
| Interquartile 75% (IQ3) | $44,589 | $56,545 |
| Interquartile Range (IQR) | $12,031 | $9,771 |
| Standard Deviation (Sample) | $10,577 | $9,645 |
| Standard Deviation (Population) | $10,524 | $9,565 |
Similar Demographics by Median Male Earnings
Demographics Similar to Navajo by Median Male Earnings
In terms of median male earnings, the demographic groups most similar to Navajo are Hopi ($42,060, a difference of 0.090%), Pima ($42,357, a difference of 0.62%), Crow ($42,434, a difference of 0.80%), Arapaho ($41,758, a difference of 0.81%), and Lumbee ($41,715, a difference of 0.92%).
| Demographics | Rating | Rank | Median Male Earnings |
| Immigrants | Congo | 0.0 /100 | #333 | Tragic $44,204 |
| Immigrants | Yemen | 0.0 /100 | #334 | Tragic $44,083 |
| Spanish American Indians | 0.0 /100 | #335 | Tragic $44,010 |
| Immigrants | Cuba | 0.0 /100 | #336 | Tragic $43,461 |
| Menominee | 0.0 /100 | #337 | Tragic $42,581 |
| Crow | 0.0 /100 | #338 | Tragic $42,434 |
| Pima | 0.0 /100 | #339 | Tragic $42,357 |
| Navajo | 0.0 /100 | #340 | Tragic $42,098 |
| Hopi | 0.0 /100 | #341 | Tragic $42,060 |
| Arapaho | 0.0 /100 | #342 | Tragic $41,758 |
| Lumbee | 0.0 /100 | #343 | Tragic $41,715 |
| Pueblo | 0.0 /100 | #344 | Tragic $41,314 |
| Puerto Ricans | 0.0 /100 | #345 | Tragic $40,071 |
| Tohono O'odham | 0.0 /100 | #346 | Tragic $39,543 |
| Yup'ik | 0.0 /100 | #347 | Tragic $39,504 |
Demographics Similar to Immigrants from Philippines by Median Male Earnings
In terms of median male earnings, the demographic groups most similar to Immigrants from Philippines are Scottish ($55,793, a difference of 0.030%), English ($55,747, a difference of 0.11%), Swiss ($55,731, a difference of 0.14%), Immigrants from Oceania ($55,712, a difference of 0.17%), and Immigrants from Chile ($55,954, a difference of 0.26%).
| Demographics | Rating | Rank | Median Male Earnings |
| Luxembourgers | 85.5 /100 | #140 | Excellent $56,300 |
| Danes | 84.8 /100 | #141 | Excellent $56,246 |
| Ethiopians | 84.8 /100 | #142 | Excellent $56,243 |
| Sri Lankans | 83.4 /100 | #143 | Excellent $56,136 |
| Immigrants | Uganda | 82.4 /100 | #144 | Excellent $56,064 |
| Norwegians | 80.9 /100 | #145 | Excellent $55,965 |
| Immigrants | Chile | 80.7 /100 | #146 | Excellent $55,954 |
| Immigrants | Philippines | 78.4 /100 | #147 | Good $55,809 |
| Scottish | 78.2 /100 | #148 | Good $55,793 |
| English | 77.4 /100 | #149 | Good $55,747 |
| Swiss | 77.1 /100 | #150 | Good $55,731 |
| Immigrants | Oceania | 76.8 /100 | #151 | Good $55,712 |
| Peruvians | 75.8 /100 | #152 | Good $55,659 |
| Immigrants | Nepal | 75.0 /100 | #153 | Good $55,615 |
| Taiwanese | 73.9 /100 | #154 | Good $55,556 |