Croatian vs Immigrants from Philippines Median Male Earnings
COMPARE
Croatian
Immigrants from Philippines
Median Male Earnings
Median Male Earnings Comparison
Croatians
Immigrants from Philippines
$59,715
MEDIAN MALE EARNINGS
99.4/ 100
METRIC RATING
82nd/ 347
METRIC RANK
$55,809
MEDIAN MALE EARNINGS
78.4/ 100
METRIC RATING
147th/ 347
METRIC RANK
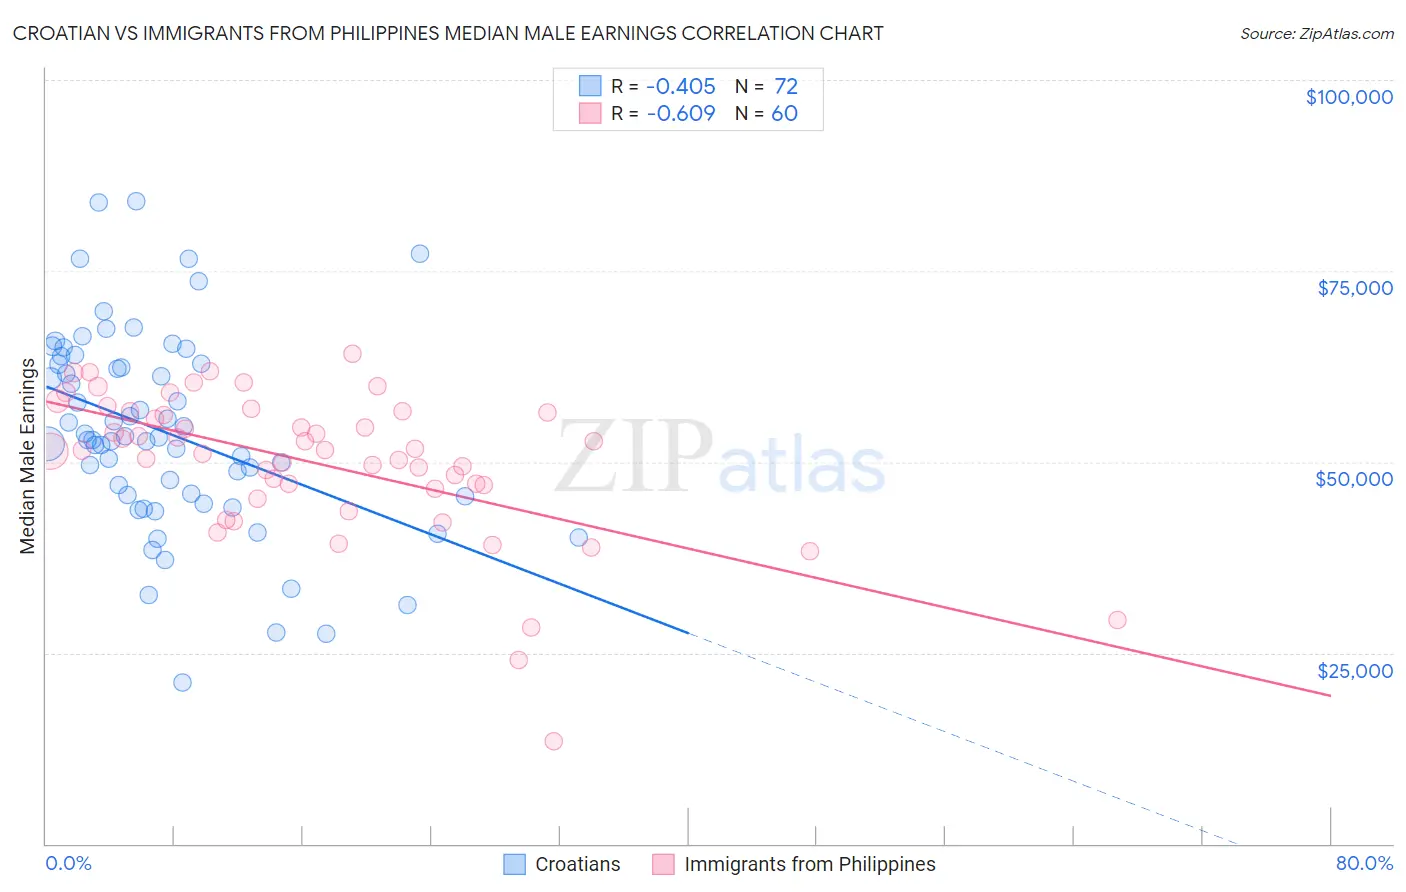
Croatian vs Immigrants from Philippines Median Male Earnings Correlation Chart
The statistical analysis conducted on geographies consisting of 375,622,931 people shows a moderate negative correlation between the proportion of Croatians and median male earnings in the United States with a correlation coefficient (R) of -0.405 and weighted average of $59,715. Similarly, the statistical analysis conducted on geographies consisting of 471,105,700 people shows a significant negative correlation between the proportion of Immigrants from Philippines and median male earnings in the United States with a correlation coefficient (R) of -0.609 and weighted average of $55,809, a difference of 7.0%.
Median Male Earnings Correlation Summary
| Measurement | Croatian | Immigrants from Philippines |
| Minimum | $21,121 | $13,438 |
| Maximum | $84,044 | $64,188 |
| Range | $62,923 | $50,750 |
| Mean | $53,900 | $49,896 |
| Median | $53,037 | $51,541 |
| Interquartile 25% (IQ1) | $45,591 | $46,774 |
| Interquartile 75% (IQ3) | $62,805 | $56,545 |
| Interquartile Range (IQR) | $17,214 | $9,771 |
| Standard Deviation (Sample) | $12,980 | $9,645 |
| Standard Deviation (Population) | $12,890 | $9,565 |
Similar Demographics by Median Male Earnings
Demographics Similar to Croatians by Median Male Earnings
In terms of median male earnings, the demographic groups most similar to Croatians are Ukrainian ($59,728, a difference of 0.020%), Immigrants from Italy ($59,691, a difference of 0.040%), Immigrants from Hungary ($59,806, a difference of 0.15%), Immigrants from Ukraine ($59,820, a difference of 0.18%), and Afghan ($59,554, a difference of 0.27%).
| Demographics | Rating | Rank | Median Male Earnings |
| Immigrants | Bolivia | 99.6 /100 | #75 | Exceptional $60,088 |
| Romanians | 99.6 /100 | #76 | Exceptional $60,063 |
| Paraguayans | 99.5 /100 | #77 | Exceptional $59,975 |
| Immigrants | Egypt | 99.5 /100 | #78 | Exceptional $59,925 |
| Immigrants | Ukraine | 99.5 /100 | #79 | Exceptional $59,820 |
| Immigrants | Hungary | 99.5 /100 | #80 | Exceptional $59,806 |
| Ukrainians | 99.4 /100 | #81 | Exceptional $59,728 |
| Croatians | 99.4 /100 | #82 | Exceptional $59,715 |
| Immigrants | Italy | 99.4 /100 | #83 | Exceptional $59,691 |
| Afghans | 99.3 /100 | #84 | Exceptional $59,554 |
| Italians | 99.3 /100 | #85 | Exceptional $59,551 |
| Immigrants | England | 99.3 /100 | #86 | Exceptional $59,527 |
| Macedonians | 99.3 /100 | #87 | Exceptional $59,522 |
| Immigrants | Argentina | 99.3 /100 | #88 | Exceptional $59,491 |
| Immigrants | Moldova | 99.2 /100 | #89 | Exceptional $59,417 |
Demographics Similar to Immigrants from Philippines by Median Male Earnings
In terms of median male earnings, the demographic groups most similar to Immigrants from Philippines are Scottish ($55,793, a difference of 0.030%), English ($55,747, a difference of 0.11%), Swiss ($55,731, a difference of 0.14%), Immigrants from Oceania ($55,712, a difference of 0.17%), and Immigrants from Chile ($55,954, a difference of 0.26%).
| Demographics | Rating | Rank | Median Male Earnings |
| Luxembourgers | 85.5 /100 | #140 | Excellent $56,300 |
| Danes | 84.8 /100 | #141 | Excellent $56,246 |
| Ethiopians | 84.8 /100 | #142 | Excellent $56,243 |
| Sri Lankans | 83.4 /100 | #143 | Excellent $56,136 |
| Immigrants | Uganda | 82.4 /100 | #144 | Excellent $56,064 |
| Norwegians | 80.9 /100 | #145 | Excellent $55,965 |
| Immigrants | Chile | 80.7 /100 | #146 | Excellent $55,954 |
| Immigrants | Philippines | 78.4 /100 | #147 | Good $55,809 |
| Scottish | 78.2 /100 | #148 | Good $55,793 |
| English | 77.4 /100 | #149 | Good $55,747 |
| Swiss | 77.1 /100 | #150 | Good $55,731 |
| Immigrants | Oceania | 76.8 /100 | #151 | Good $55,712 |
| Peruvians | 75.8 /100 | #152 | Good $55,659 |
| Immigrants | Nepal | 75.0 /100 | #153 | Good $55,615 |
| Taiwanese | 73.9 /100 | #154 | Good $55,556 |