Navajo vs African Householder Income Ages 25 - 44 years
COMPARE
Navajo
African
Householder Income Ages 25 - 44 years
Householder Income Ages 25 - 44 years Comparison
Navajo
Africans
$66,529
HOUSEHOLDER INCOME AGES 25 - 44 YEARS
0.0/ 100
METRIC RATING
345th/ 347
METRIC RANK
$78,986
HOUSEHOLDER INCOME AGES 25 - 44 YEARS
0.0/ 100
METRIC RATING
316th/ 347
METRIC RANK
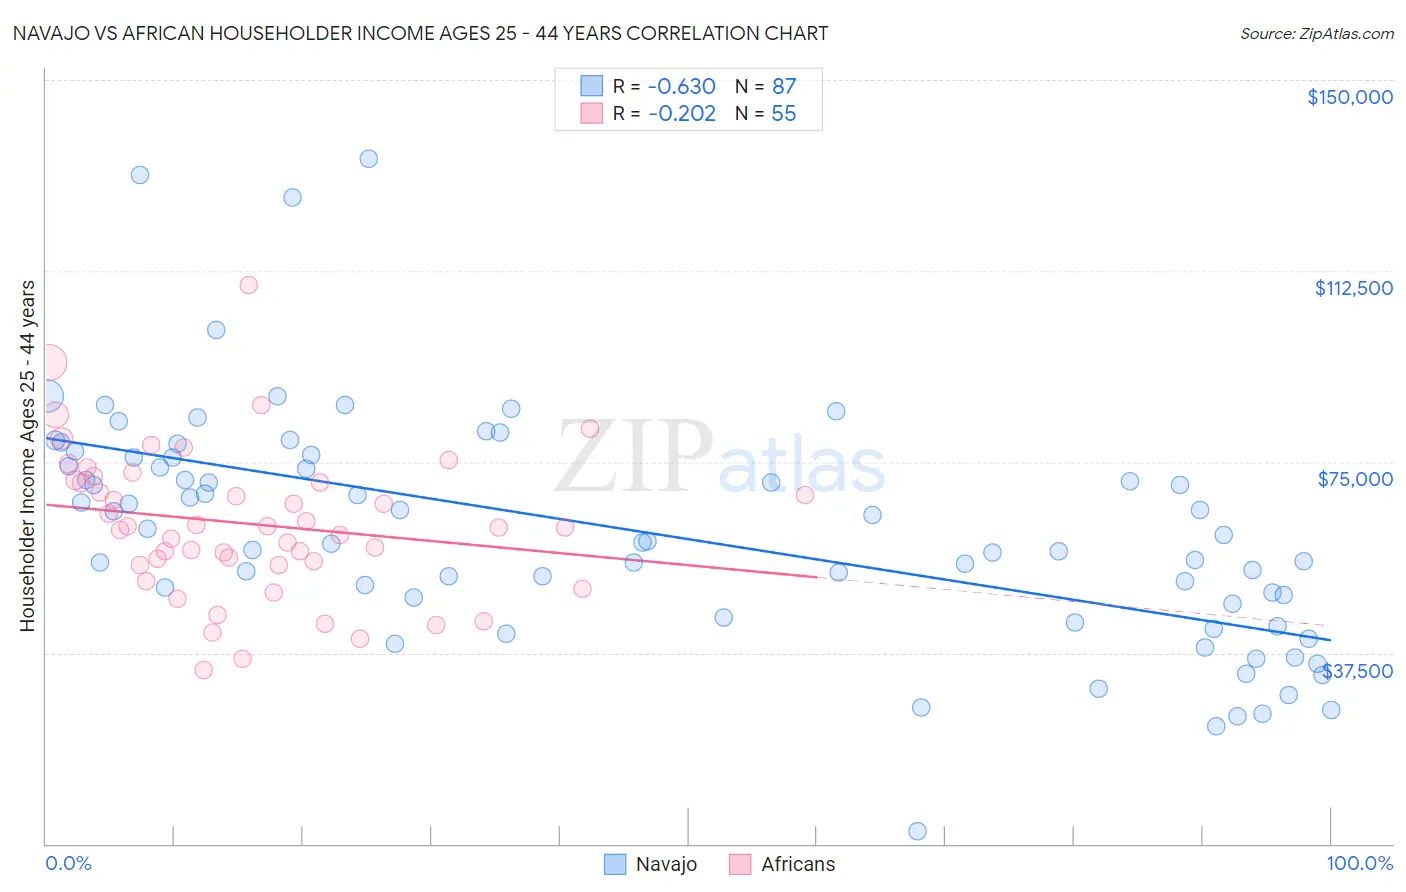
Navajo vs African Householder Income Ages 25 - 44 years Correlation Chart
The statistical analysis conducted on geographies consisting of 224,307,883 people shows a significant negative correlation between the proportion of Navajo and household income with householder between the ages 25 and 44 in the United States with a correlation coefficient (R) of -0.630 and weighted average of $66,529. Similarly, the statistical analysis conducted on geographies consisting of 468,079,213 people shows a weak negative correlation between the proportion of Africans and household income with householder between the ages 25 and 44 in the United States with a correlation coefficient (R) of -0.202 and weighted average of $78,986, a difference of 18.7%.
Householder Income Ages 25 - 44 years Correlation Summary
| Measurement | Navajo | African |
| Minimum | $2,499 | $34,242 |
| Maximum | $134,464 | $109,792 |
| Range | $131,965 | $75,550 |
| Mean | $61,342 | $62,789 |
| Median | $59,389 | $62,232 |
| Interquartile 25% (IQ1) | $47,194 | $54,869 |
| Interquartile 75% (IQ3) | $75,867 | $71,404 |
| Interquartile Range (IQR) | $28,673 | $16,535 |
| Standard Deviation (Sample) | $22,974 | $14,499 |
| Standard Deviation (Population) | $22,841 | $14,367 |
Similar Demographics by Householder Income Ages 25 - 44 years
Demographics Similar to Navajo by Householder Income Ages 25 - 44 years
In terms of householder income ages 25 - 44 years, the demographic groups most similar to Navajo are Puerto Rican ($65,996, a difference of 0.81%), Pueblo ($68,910, a difference of 3.6%), Tohono O'odham ($69,068, a difference of 3.8%), Crow ($71,337, a difference of 7.2%), and Arapaho ($71,697, a difference of 7.8%).
| Demographics | Rating | Rank | Householder Income Ages 25 - 44 years |
| Hopi | 0.0 /100 | #333 | Tragic $75,002 |
| Creek | 0.0 /100 | #334 | Tragic $74,847 |
| Kiowa | 0.0 /100 | #335 | Tragic $74,776 |
| Yup'ik | 0.0 /100 | #336 | Tragic $73,688 |
| Blacks/African Americans | 0.0 /100 | #337 | Tragic $73,370 |
| Immigrants | Yemen | 0.0 /100 | #338 | Tragic $73,043 |
| Yuman | 0.0 /100 | #339 | Tragic $72,956 |
| Immigrants | Congo | 0.0 /100 | #340 | Tragic $72,178 |
| Arapaho | 0.0 /100 | #341 | Tragic $71,697 |
| Crow | 0.0 /100 | #342 | Tragic $71,337 |
| Tohono O'odham | 0.0 /100 | #343 | Tragic $69,068 |
| Pueblo | 0.0 /100 | #344 | Tragic $68,910 |
| Navajo | 0.0 /100 | #345 | Tragic $66,529 |
| Puerto Ricans | 0.0 /100 | #346 | Tragic $65,996 |
| Lumbee | 0.0 /100 | #347 | Tragic $60,305 |
Demographics Similar to Africans by Householder Income Ages 25 - 44 years
In terms of householder income ages 25 - 44 years, the demographic groups most similar to Africans are Ottawa ($79,012, a difference of 0.030%), U.S. Virgin Islander ($78,911, a difference of 0.090%), Cheyenne ($79,152, a difference of 0.21%), Immigrants from Mexico ($78,809, a difference of 0.22%), and Menominee ($79,358, a difference of 0.47%).
| Demographics | Rating | Rank | Householder Income Ages 25 - 44 years |
| Chippewa | 0.0 /100 | #309 | Tragic $80,005 |
| Fijians | 0.0 /100 | #310 | Tragic $79,956 |
| Indonesians | 0.0 /100 | #311 | Tragic $79,543 |
| Immigrants | Haiti | 0.0 /100 | #312 | Tragic $79,391 |
| Menominee | 0.0 /100 | #313 | Tragic $79,358 |
| Cheyenne | 0.0 /100 | #314 | Tragic $79,152 |
| Ottawa | 0.0 /100 | #315 | Tragic $79,012 |
| Africans | 0.0 /100 | #316 | Tragic $78,986 |
| U.S. Virgin Islanders | 0.0 /100 | #317 | Tragic $78,911 |
| Immigrants | Mexico | 0.0 /100 | #318 | Tragic $78,809 |
| Hondurans | 0.0 /100 | #319 | Tragic $78,540 |
| Choctaw | 0.0 /100 | #320 | Tragic $78,168 |
| Immigrants | Zaire | 0.0 /100 | #321 | Tragic $78,045 |
| Chickasaw | 0.0 /100 | #322 | Tragic $77,929 |
| Immigrants | Honduras | 0.0 /100 | #323 | Tragic $77,328 |