Immigrants from Ecuador vs African Householder Income Ages 25 - 44 years
COMPARE
Immigrants from Ecuador
African
Householder Income Ages 25 - 44 years
Householder Income Ages 25 - 44 years Comparison
Immigrants from Ecuador
Africans
$89,673
HOUSEHOLDER INCOME AGES 25 - 44 YEARS
6.2/ 100
METRIC RATING
222nd/ 347
METRIC RANK
$78,986
HOUSEHOLDER INCOME AGES 25 - 44 YEARS
0.0/ 100
METRIC RATING
316th/ 347
METRIC RANK
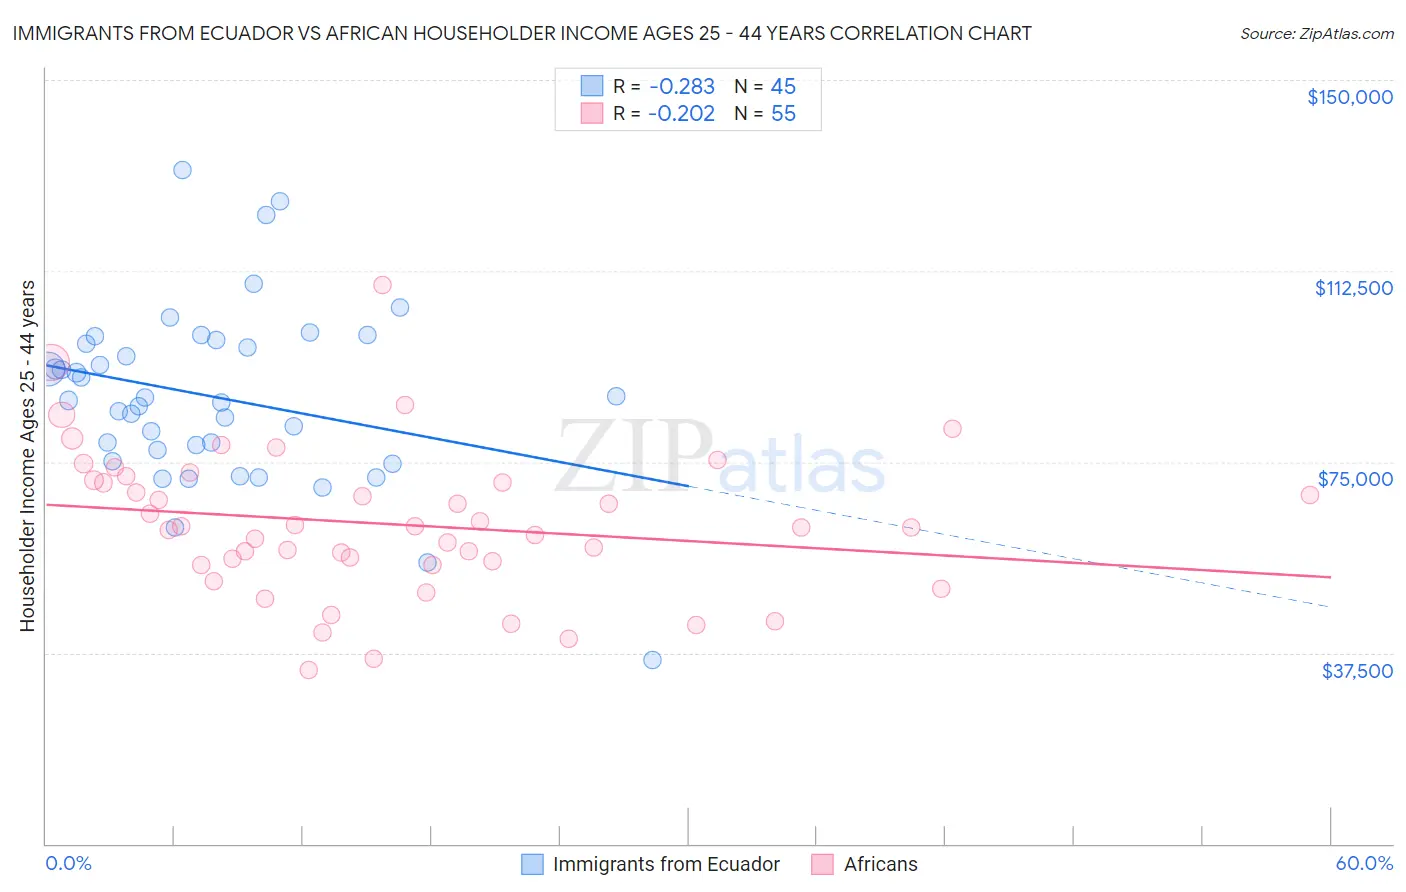
Immigrants from Ecuador vs African Householder Income Ages 25 - 44 years Correlation Chart
The statistical analysis conducted on geographies consisting of 270,658,714 people shows a weak negative correlation between the proportion of Immigrants from Ecuador and household income with householder between the ages 25 and 44 in the United States with a correlation coefficient (R) of -0.283 and weighted average of $89,673. Similarly, the statistical analysis conducted on geographies consisting of 468,079,213 people shows a weak negative correlation between the proportion of Africans and household income with householder between the ages 25 and 44 in the United States with a correlation coefficient (R) of -0.202 and weighted average of $78,986, a difference of 13.5%.
Householder Income Ages 25 - 44 years Correlation Summary
| Measurement | Immigrants from Ecuador | African |
| Minimum | $36,176 | $34,242 |
| Maximum | $132,426 | $109,792 |
| Range | $96,250 | $75,550 |
| Mean | $87,697 | $62,789 |
| Median | $87,101 | $62,232 |
| Interquartile 25% (IQ1) | $76,225 | $54,869 |
| Interquartile 75% (IQ3) | $98,630 | $71,404 |
| Interquartile Range (IQR) | $22,405 | $16,535 |
| Standard Deviation (Sample) | $17,650 | $14,499 |
| Standard Deviation (Population) | $17,453 | $14,367 |
Similar Demographics by Householder Income Ages 25 - 44 years
Demographics Similar to Immigrants from Ecuador by Householder Income Ages 25 - 44 years
In terms of householder income ages 25 - 44 years, the demographic groups most similar to Immigrants from Ecuador are Immigrants from Trinidad and Tobago ($89,748, a difference of 0.080%), Immigrants from Guyana ($89,586, a difference of 0.10%), Barbadian ($89,565, a difference of 0.12%), Trinidadian and Tobagonian ($89,856, a difference of 0.20%), and Delaware ($89,876, a difference of 0.23%).
| Demographics | Rating | Rank | Householder Income Ages 25 - 44 years |
| Panamanians | 8.1 /100 | #215 | Tragic $90,193 |
| Ghanaians | 7.9 /100 | #216 | Tragic $90,137 |
| Scotch-Irish | 7.3 /100 | #217 | Tragic $89,969 |
| Guyanese | 7.1 /100 | #218 | Tragic $89,940 |
| Delaware | 6.9 /100 | #219 | Tragic $89,876 |
| Trinidadians and Tobagonians | 6.8 /100 | #220 | Tragic $89,856 |
| Immigrants | Trinidad and Tobago | 6.5 /100 | #221 | Tragic $89,748 |
| Immigrants | Ecuador | 6.2 /100 | #222 | Tragic $89,673 |
| Immigrants | Guyana | 5.9 /100 | #223 | Tragic $89,586 |
| Barbadians | 5.9 /100 | #224 | Tragic $89,565 |
| Immigrants | Panama | 5.5 /100 | #225 | Tragic $89,451 |
| Immigrants | Iraq | 5.5 /100 | #226 | Tragic $89,444 |
| Immigrants | St. Vincent and the Grenadines | 4.1 /100 | #227 | Tragic $88,888 |
| Immigrants | Bosnia and Herzegovina | 4.0 /100 | #228 | Tragic $88,819 |
| Immigrants | Barbados | 3.7 /100 | #229 | Tragic $88,687 |
Demographics Similar to Africans by Householder Income Ages 25 - 44 years
In terms of householder income ages 25 - 44 years, the demographic groups most similar to Africans are Ottawa ($79,012, a difference of 0.030%), U.S. Virgin Islander ($78,911, a difference of 0.090%), Cheyenne ($79,152, a difference of 0.21%), Immigrants from Mexico ($78,809, a difference of 0.22%), and Menominee ($79,358, a difference of 0.47%).
| Demographics | Rating | Rank | Householder Income Ages 25 - 44 years |
| Chippewa | 0.0 /100 | #309 | Tragic $80,005 |
| Fijians | 0.0 /100 | #310 | Tragic $79,956 |
| Indonesians | 0.0 /100 | #311 | Tragic $79,543 |
| Immigrants | Haiti | 0.0 /100 | #312 | Tragic $79,391 |
| Menominee | 0.0 /100 | #313 | Tragic $79,358 |
| Cheyenne | 0.0 /100 | #314 | Tragic $79,152 |
| Ottawa | 0.0 /100 | #315 | Tragic $79,012 |
| Africans | 0.0 /100 | #316 | Tragic $78,986 |
| U.S. Virgin Islanders | 0.0 /100 | #317 | Tragic $78,911 |
| Immigrants | Mexico | 0.0 /100 | #318 | Tragic $78,809 |
| Hondurans | 0.0 /100 | #319 | Tragic $78,540 |
| Choctaw | 0.0 /100 | #320 | Tragic $78,168 |
| Immigrants | Zaire | 0.0 /100 | #321 | Tragic $78,045 |
| Chickasaw | 0.0 /100 | #322 | Tragic $77,929 |
| Immigrants | Honduras | 0.0 /100 | #323 | Tragic $77,328 |