Latvian vs Dutch West Indian Householder Income Under 25 years
COMPARE
Latvian
Dutch West Indian
Householder Income Under 25 years
Householder Income Under 25 years Comparison
Latvians
Dutch West Indians
$52,783
HOUSEHOLDER INCOME UNDER 25 YEARS
81.0/ 100
METRIC RATING
147th/ 347
METRIC RANK
$45,816
HOUSEHOLDER INCOME UNDER 25 YEARS
0.0/ 100
METRIC RATING
324th/ 347
METRIC RANK
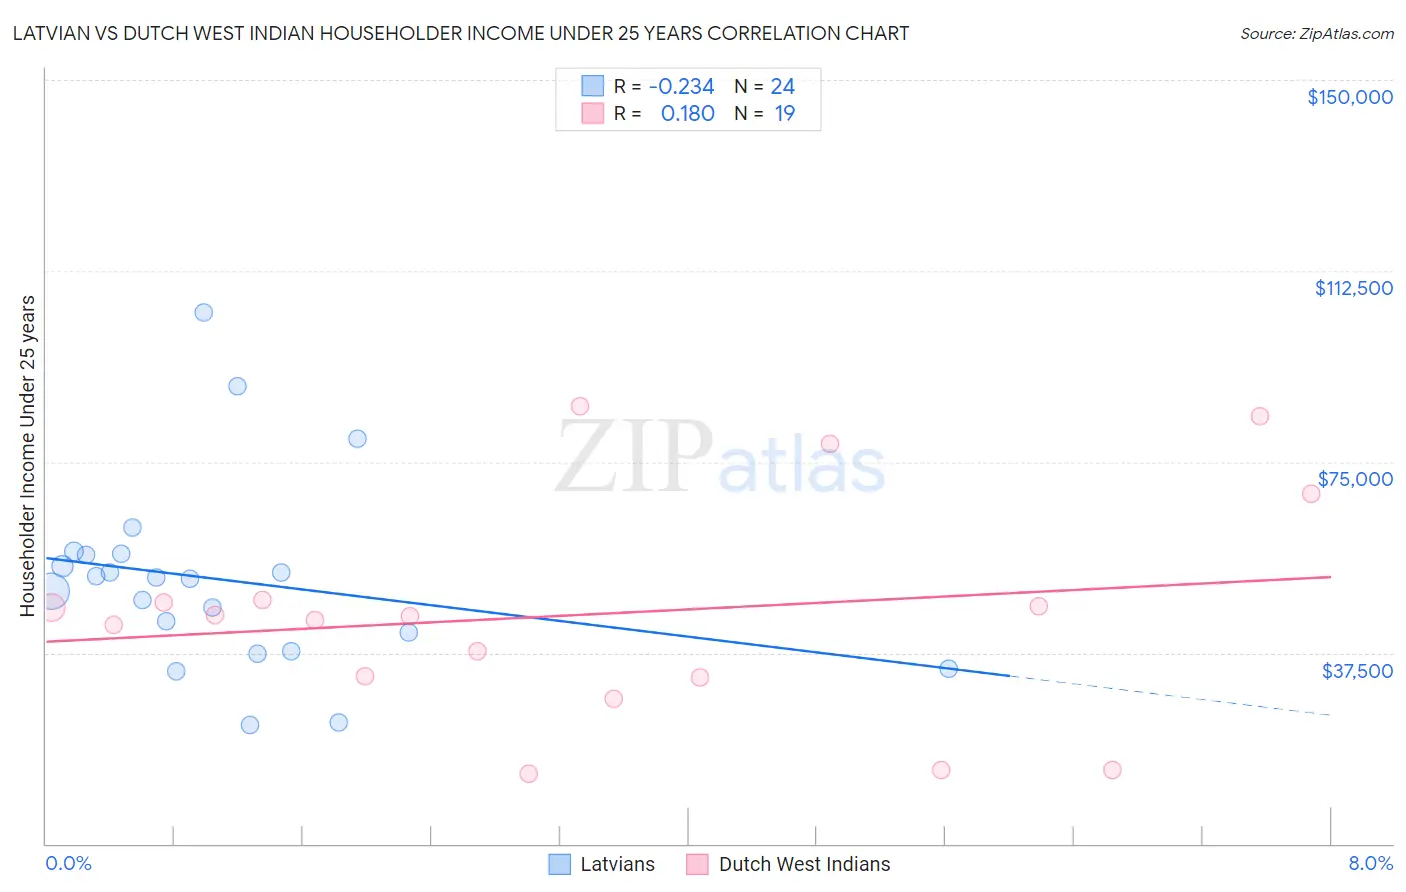
Latvian vs Dutch West Indian Householder Income Under 25 years Correlation Chart
The statistical analysis conducted on geographies consisting of 192,099,728 people shows a weak negative correlation between the proportion of Latvians and household income with householder under the age of 25 in the United States with a correlation coefficient (R) of -0.234 and weighted average of $52,783. Similarly, the statistical analysis conducted on geographies consisting of 80,349,978 people shows a poor positive correlation between the proportion of Dutch West Indians and household income with householder under the age of 25 in the United States with a correlation coefficient (R) of 0.180 and weighted average of $45,816, a difference of 15.2%.
Householder Income Under 25 years Correlation Summary
| Measurement | Latvian | Dutch West Indian |
| Minimum | $23,229 | $13,750 |
| Maximum | $104,283 | $85,865 |
| Range | $81,054 | $72,115 |
| Mean | $51,847 | $45,099 |
| Median | $52,213 | $44,797 |
| Interquartile 25% (IQ1) | $39,684 | $32,543 |
| Interquartile 75% (IQ3) | $56,857 | $47,825 |
| Interquartile Range (IQR) | $17,174 | $15,281 |
| Standard Deviation (Sample) | $18,675 | $21,553 |
| Standard Deviation (Population) | $18,282 | $20,979 |
Similar Demographics by Householder Income Under 25 years
Demographics Similar to Latvians by Householder Income Under 25 years
In terms of householder income under 25 years, the demographic groups most similar to Latvians are Immigrants from Hungary ($52,798, a difference of 0.030%), French Canadian ($52,672, a difference of 0.21%), Scandinavian ($52,654, a difference of 0.24%), Immigrants from Costa Rica ($52,643, a difference of 0.27%), and Immigrants from Scotland ($52,638, a difference of 0.28%).
| Demographics | Rating | Rank | Householder Income Under 25 years |
| Hawaiians | 89.8 /100 | #140 | Excellent $53,078 |
| Danes | 88.9 /100 | #141 | Excellent $53,041 |
| Immigrants | Armenia | 87.5 /100 | #142 | Excellent $52,986 |
| Swedes | 87.5 /100 | #143 | Excellent $52,986 |
| South American Indians | 87.3 /100 | #144 | Excellent $52,979 |
| Immigrants | Western Europe | 86.7 /100 | #145 | Excellent $52,957 |
| Immigrants | Hungary | 81.6 /100 | #146 | Excellent $52,798 |
| Latvians | 81.0 /100 | #147 | Excellent $52,783 |
| French Canadians | 76.5 /100 | #148 | Good $52,672 |
| Scandinavians | 75.7 /100 | #149 | Good $52,654 |
| Immigrants | Costa Rica | 75.2 /100 | #150 | Good $52,643 |
| Immigrants | Scotland | 75.0 /100 | #151 | Good $52,638 |
| Trinidadians and Tobagonians | 74.6 /100 | #152 | Good $52,631 |
| Central Americans | 74.4 /100 | #153 | Good $52,626 |
| Immigrants | Azores | 74.2 /100 | #154 | Good $52,621 |
Demographics Similar to Dutch West Indians by Householder Income Under 25 years
In terms of householder income under 25 years, the demographic groups most similar to Dutch West Indians are Immigrants from Bahamas ($45,793, a difference of 0.050%), Osage ($45,764, a difference of 0.11%), Bahamian ($45,743, a difference of 0.16%), German Russian ($45,673, a difference of 0.31%), and Seminole ($45,649, a difference of 0.37%).
| Demographics | Rating | Rank | Householder Income Under 25 years |
| Hopi | 0.0 /100 | #317 | Tragic $46,978 |
| Spanish Americans | 0.0 /100 | #318 | Tragic $46,913 |
| Africans | 0.0 /100 | #319 | Tragic $46,838 |
| Immigrants | Sudan | 0.0 /100 | #320 | Tragic $46,791 |
| Potawatomi | 0.0 /100 | #321 | Tragic $46,462 |
| Sioux | 0.0 /100 | #322 | Tragic $46,417 |
| Immigrants | Saudi Arabia | 0.0 /100 | #323 | Tragic $46,187 |
| Dutch West Indians | 0.0 /100 | #324 | Tragic $45,816 |
| Immigrants | Bahamas | 0.0 /100 | #325 | Tragic $45,793 |
| Osage | 0.0 /100 | #326 | Tragic $45,764 |
| Bahamians | 0.0 /100 | #327 | Tragic $45,743 |
| German Russians | 0.0 /100 | #328 | Tragic $45,673 |
| Seminole | 0.0 /100 | #329 | Tragic $45,649 |
| Indonesians | 0.0 /100 | #330 | Tragic $45,566 |
| Immigrants | Zaire | 0.0 /100 | #331 | Tragic $45,529 |