Immigrants from Eastern Asia vs Dutch West Indian Householder Income Under 25 years
COMPARE
Immigrants from Eastern Asia
Dutch West Indian
Householder Income Under 25 years
Householder Income Under 25 years Comparison
Immigrants from Eastern Asia
Dutch West Indians
$57,123
HOUSEHOLDER INCOME UNDER 25 YEARS
100.0/ 100
METRIC RATING
18th/ 347
METRIC RANK
$45,816
HOUSEHOLDER INCOME UNDER 25 YEARS
0.0/ 100
METRIC RATING
324th/ 347
METRIC RANK
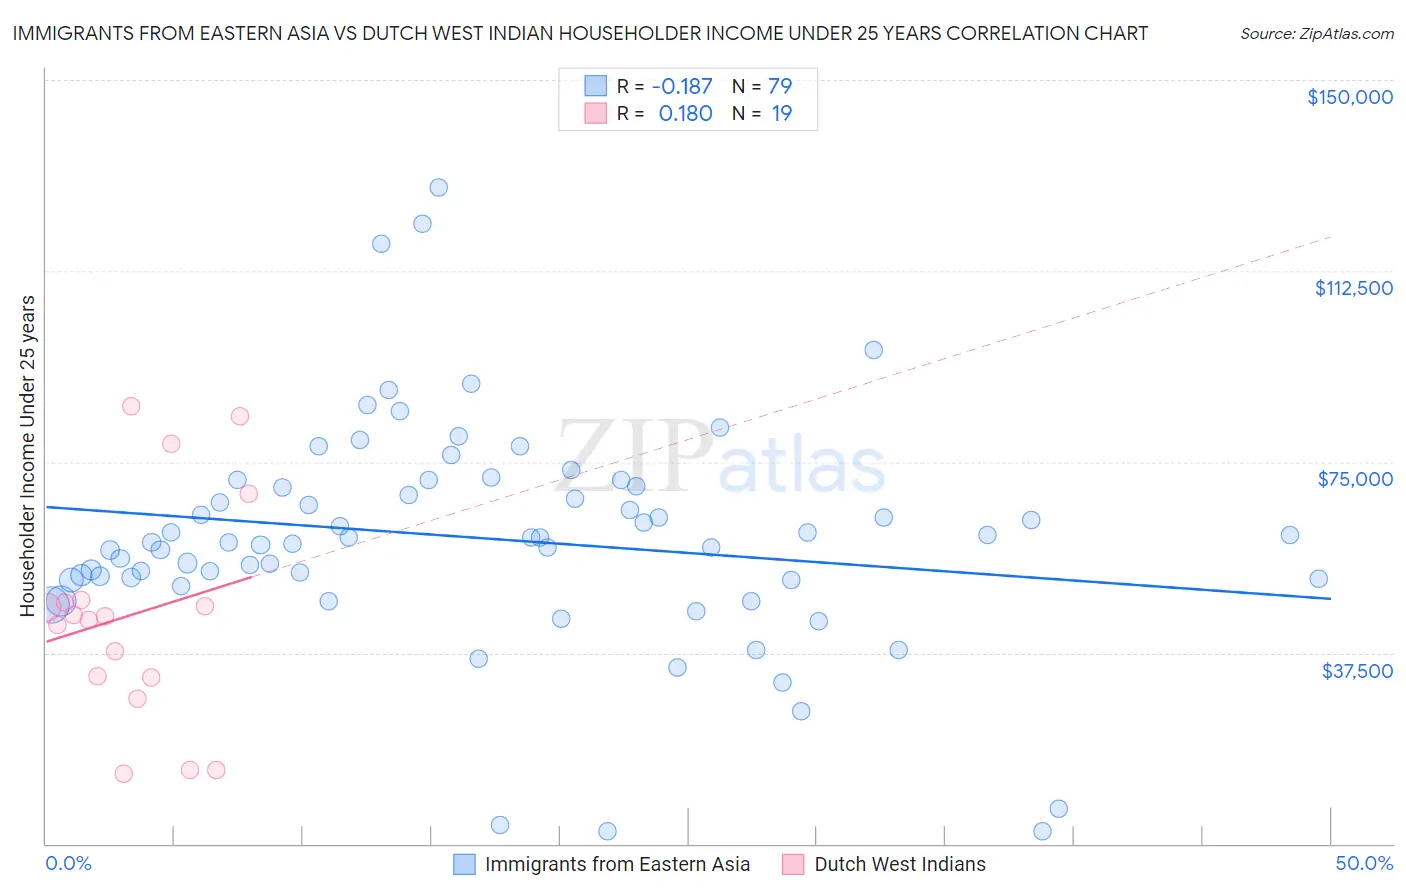
Immigrants from Eastern Asia vs Dutch West Indian Householder Income Under 25 years Correlation Chart
The statistical analysis conducted on geographies consisting of 404,825,036 people shows a poor negative correlation between the proportion of Immigrants from Eastern Asia and household income with householder under the age of 25 in the United States with a correlation coefficient (R) of -0.187 and weighted average of $57,123. Similarly, the statistical analysis conducted on geographies consisting of 80,349,978 people shows a poor positive correlation between the proportion of Dutch West Indians and household income with householder under the age of 25 in the United States with a correlation coefficient (R) of 0.180 and weighted average of $45,816, a difference of 24.7%.
Householder Income Under 25 years Correlation Summary
| Measurement | Immigrants from Eastern Asia | Dutch West Indian |
| Minimum | $2,499 | $13,750 |
| Maximum | $128,934 | $85,865 |
| Range | $126,435 | $72,115 |
| Mean | $60,019 | $45,099 |
| Median | $59,251 | $44,797 |
| Interquartile 25% (IQ1) | $51,848 | $32,543 |
| Interquartile 75% (IQ3) | $70,202 | $47,825 |
| Interquartile Range (IQR) | $18,354 | $15,281 |
| Standard Deviation (Sample) | $22,245 | $21,553 |
| Standard Deviation (Population) | $22,104 | $20,979 |
Similar Demographics by Householder Income Under 25 years
Demographics Similar to Immigrants from Eastern Asia by Householder Income Under 25 years
In terms of householder income under 25 years, the demographic groups most similar to Immigrants from Eastern Asia are Bhutanese ($57,078, a difference of 0.080%), Immigrants from Ireland ($57,075, a difference of 0.080%), Immigrants from Fiji ($57,074, a difference of 0.090%), Asian ($57,003, a difference of 0.21%), and Sierra Leonean ($57,272, a difference of 0.26%).
| Demographics | Rating | Rank | Householder Income Under 25 years |
| Immigrants | China | 100.0 /100 | #11 | Exceptional $57,931 |
| Immigrants | Philippines | 100.0 /100 | #12 | Exceptional $57,930 |
| Immigrants | South Central Asia | 100.0 /100 | #13 | Exceptional $57,818 |
| Filipinos | 100.0 /100 | #14 | Exceptional $57,740 |
| Koreans | 100.0 /100 | #15 | Exceptional $57,730 |
| Immigrants | Afghanistan | 100.0 /100 | #16 | Exceptional $57,478 |
| Sierra Leoneans | 100.0 /100 | #17 | Exceptional $57,272 |
| Immigrants | Eastern Asia | 100.0 /100 | #18 | Exceptional $57,123 |
| Bhutanese | 100.0 /100 | #19 | Exceptional $57,078 |
| Immigrants | Ireland | 100.0 /100 | #20 | Exceptional $57,075 |
| Immigrants | Fiji | 100.0 /100 | #21 | Exceptional $57,074 |
| Asians | 100.0 /100 | #22 | Exceptional $57,003 |
| Tongans | 100.0 /100 | #23 | Exceptional $56,972 |
| Immigrants | Singapore | 100.0 /100 | #24 | Exceptional $56,835 |
| Immigrants | Pakistan | 100.0 /100 | #25 | Exceptional $56,789 |
Demographics Similar to Dutch West Indians by Householder Income Under 25 years
In terms of householder income under 25 years, the demographic groups most similar to Dutch West Indians are Immigrants from Bahamas ($45,793, a difference of 0.050%), Osage ($45,764, a difference of 0.11%), Bahamian ($45,743, a difference of 0.16%), German Russian ($45,673, a difference of 0.31%), and Seminole ($45,649, a difference of 0.37%).
| Demographics | Rating | Rank | Householder Income Under 25 years |
| Hopi | 0.0 /100 | #317 | Tragic $46,978 |
| Spanish Americans | 0.0 /100 | #318 | Tragic $46,913 |
| Africans | 0.0 /100 | #319 | Tragic $46,838 |
| Immigrants | Sudan | 0.0 /100 | #320 | Tragic $46,791 |
| Potawatomi | 0.0 /100 | #321 | Tragic $46,462 |
| Sioux | 0.0 /100 | #322 | Tragic $46,417 |
| Immigrants | Saudi Arabia | 0.0 /100 | #323 | Tragic $46,187 |
| Dutch West Indians | 0.0 /100 | #324 | Tragic $45,816 |
| Immigrants | Bahamas | 0.0 /100 | #325 | Tragic $45,793 |
| Osage | 0.0 /100 | #326 | Tragic $45,764 |
| Bahamians | 0.0 /100 | #327 | Tragic $45,743 |
| German Russians | 0.0 /100 | #328 | Tragic $45,673 |
| Seminole | 0.0 /100 | #329 | Tragic $45,649 |
| Indonesians | 0.0 /100 | #330 | Tragic $45,566 |
| Immigrants | Zaire | 0.0 /100 | #331 | Tragic $45,529 |