Iraqi vs Slovak Per Capita Income
COMPARE
Iraqi
Slovak
Per Capita Income
Per Capita Income Comparison
Iraqis
Slovaks
$42,760
PER CAPITA INCOME
26.7/ 100
METRIC RATING
192nd/ 347
METRIC RANK
$44,229
PER CAPITA INCOME
65.4/ 100
METRIC RATING
156th/ 347
METRIC RANK
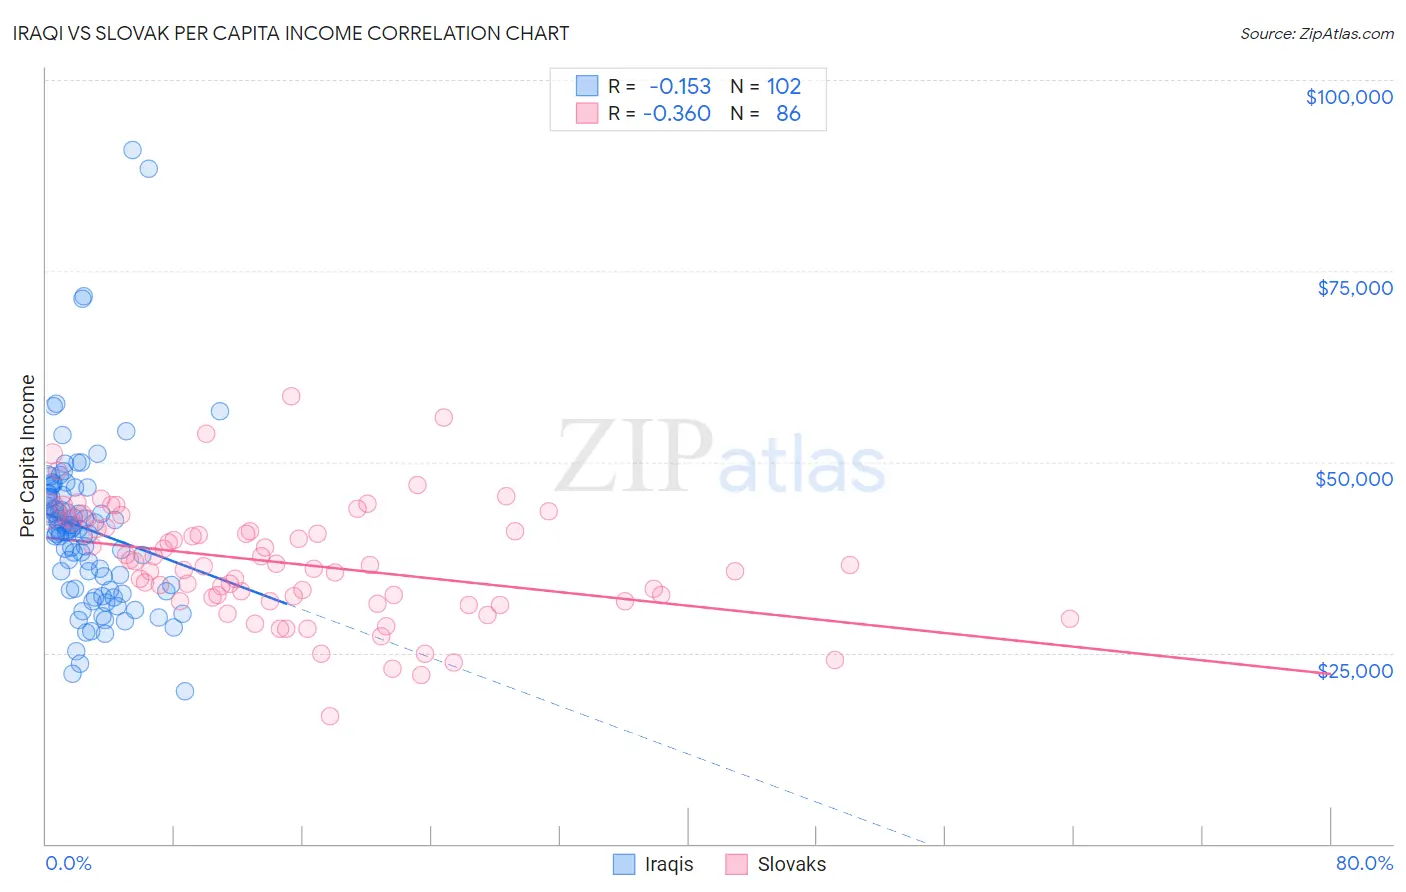
Iraqi vs Slovak Per Capita Income Correlation Chart
The statistical analysis conducted on geographies consisting of 170,626,957 people shows a poor negative correlation between the proportion of Iraqis and per capita income in the United States with a correlation coefficient (R) of -0.153 and weighted average of $42,760. Similarly, the statistical analysis conducted on geographies consisting of 397,898,984 people shows a mild negative correlation between the proportion of Slovaks and per capita income in the United States with a correlation coefficient (R) of -0.360 and weighted average of $44,229, a difference of 3.4%.
Per Capita Income Correlation Summary
| Measurement | Iraqi | Slovak |
| Minimum | $19,973 | $16,734 |
| Maximum | $90,903 | $58,546 |
| Range | $70,930 | $41,812 |
| Mean | $41,246 | $36,677 |
| Median | $41,205 | $36,437 |
| Interquartile 25% (IQ1) | $33,285 | $31,763 |
| Interquartile 75% (IQ3) | $45,684 | $41,360 |
| Interquartile Range (IQR) | $12,399 | $9,597 |
| Standard Deviation (Sample) | $11,272 | $7,565 |
| Standard Deviation (Population) | $11,217 | $7,521 |
Similar Demographics by Per Capita Income
Demographics Similar to Iraqis by Per Capita Income
In terms of per capita income, the demographic groups most similar to Iraqis are Immigrants from Sierra Leone ($42,752, a difference of 0.020%), Yugoslavian ($42,792, a difference of 0.070%), Kenyan ($42,808, a difference of 0.11%), Immigrants from Fiji ($42,694, a difference of 0.16%), and Immigrants from Kenya ($42,661, a difference of 0.23%).
| Demographics | Rating | Rank | Per Capita Income |
| Immigrants | Immigrants | 32.5 /100 | #185 | Fair $43,010 |
| French Canadians | 32.3 /100 | #186 | Fair $43,003 |
| Immigrants | Colombia | 31.5 /100 | #187 | Fair $42,971 |
| Immigrants | Africa | 31.0 /100 | #188 | Fair $42,950 |
| Bermudans | 30.1 /100 | #189 | Fair $42,911 |
| Kenyans | 27.7 /100 | #190 | Fair $42,808 |
| Yugoslavians | 27.4 /100 | #191 | Fair $42,792 |
| Iraqis | 26.7 /100 | #192 | Fair $42,760 |
| Immigrants | Sierra Leone | 26.5 /100 | #193 | Fair $42,752 |
| Immigrants | Fiji | 25.2 /100 | #194 | Fair $42,694 |
| Immigrants | Kenya | 24.5 /100 | #195 | Fair $42,661 |
| Dutch | 23.4 /100 | #196 | Fair $42,605 |
| Scotch-Irish | 22.6 /100 | #197 | Fair $42,563 |
| Immigrants | Portugal | 19.7 /100 | #198 | Poor $42,412 |
| Barbadians | 19.6 /100 | #199 | Poor $42,406 |
Demographics Similar to Slovaks by Per Capita Income
In terms of per capita income, the demographic groups most similar to Slovaks are South American Indian ($44,206, a difference of 0.050%), Immigrants from Nepal ($44,187, a difference of 0.090%), Uruguayan ($44,318, a difference of 0.20%), South American ($44,114, a difference of 0.26%), and Portuguese ($44,362, a difference of 0.30%).
| Demographics | Rating | Rank | Per Capita Income |
| Koreans | 72.5 /100 | #149 | Good $44,522 |
| Immigrants | Eritrea | 72.1 /100 | #150 | Good $44,509 |
| Norwegians | 71.5 /100 | #151 | Good $44,480 |
| Peruvians | 71.5 /100 | #152 | Good $44,479 |
| Scottish | 70.6 /100 | #153 | Good $44,440 |
| Portuguese | 68.7 /100 | #154 | Good $44,362 |
| Uruguayans | 67.6 /100 | #155 | Good $44,318 |
| Slovaks | 65.4 /100 | #156 | Good $44,229 |
| South American Indians | 64.8 /100 | #157 | Good $44,206 |
| Immigrants | Nepal | 64.3 /100 | #158 | Good $44,187 |
| South Americans | 62.4 /100 | #159 | Good $44,114 |
| Danes | 61.9 /100 | #160 | Good $44,095 |
| Costa Ricans | 61.8 /100 | #161 | Good $44,090 |
| Swiss | 61.4 /100 | #162 | Good $44,076 |
| Immigrants | South America | 61.2 /100 | #163 | Good $44,068 |