Estonian vs Slovak Per Capita Income
COMPARE
Estonian
Slovak
Per Capita Income
Per Capita Income Comparison
Estonians
Slovaks
$51,875
PER CAPITA INCOME
100.0/ 100
METRIC RATING
37th/ 347
METRIC RANK
$44,229
PER CAPITA INCOME
65.4/ 100
METRIC RATING
156th/ 347
METRIC RANK
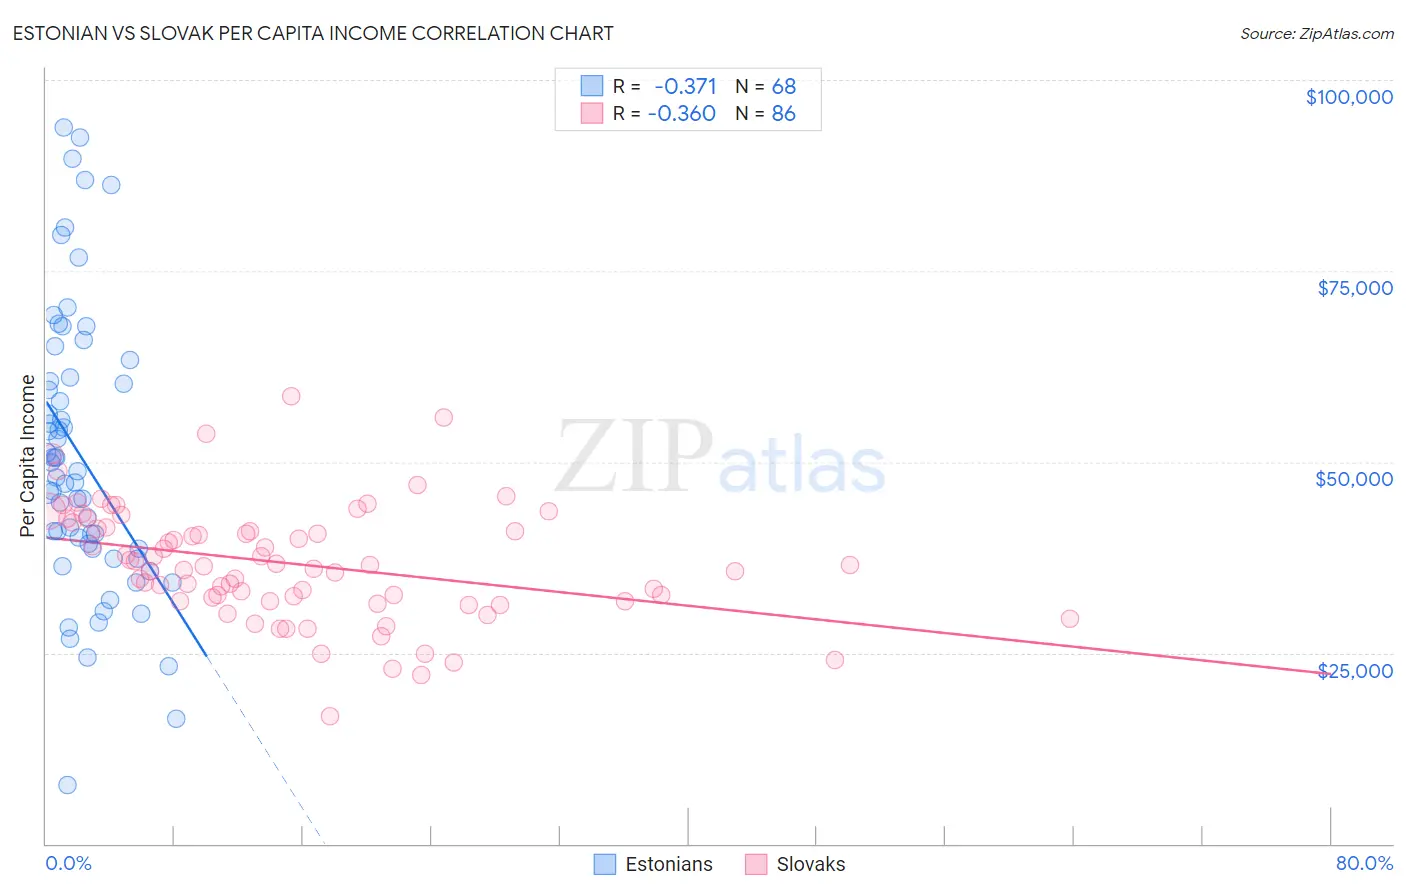
Estonian vs Slovak Per Capita Income Correlation Chart
The statistical analysis conducted on geographies consisting of 123,528,060 people shows a mild negative correlation between the proportion of Estonians and per capita income in the United States with a correlation coefficient (R) of -0.371 and weighted average of $51,875. Similarly, the statistical analysis conducted on geographies consisting of 397,898,984 people shows a mild negative correlation between the proportion of Slovaks and per capita income in the United States with a correlation coefficient (R) of -0.360 and weighted average of $44,229, a difference of 17.3%.
Per Capita Income Correlation Summary
| Measurement | Estonian | Slovak |
| Minimum | $7,734 | $16,734 |
| Maximum | $93,762 | $58,546 |
| Range | $86,028 | $41,812 |
| Mean | $50,630 | $36,677 |
| Median | $48,349 | $36,437 |
| Interquartile 25% (IQ1) | $38,645 | $31,763 |
| Interquartile 75% (IQ3) | $60,738 | $41,360 |
| Interquartile Range (IQR) | $22,093 | $9,597 |
| Standard Deviation (Sample) | $18,388 | $7,565 |
| Standard Deviation (Population) | $18,253 | $7,521 |
Similar Demographics by Per Capita Income
Demographics Similar to Estonians by Per Capita Income
In terms of per capita income, the demographic groups most similar to Estonians are Immigrants from Greece ($51,891, a difference of 0.030%), Immigrants from Czechoslovakia ($51,770, a difference of 0.20%), Burmese ($52,005, a difference of 0.25%), Cambodian ($51,731, a difference of 0.28%), and Immigrants from Russia ($52,044, a difference of 0.33%).
| Demographics | Rating | Rank | Per Capita Income |
| Immigrants | Austria | 100.0 /100 | #30 | Exceptional $52,503 |
| Turks | 100.0 /100 | #31 | Exceptional $52,391 |
| Immigrants | Norway | 100.0 /100 | #32 | Exceptional $52,217 |
| Australians | 100.0 /100 | #33 | Exceptional $52,074 |
| Immigrants | Russia | 100.0 /100 | #34 | Exceptional $52,044 |
| Burmese | 100.0 /100 | #35 | Exceptional $52,005 |
| Immigrants | Greece | 100.0 /100 | #36 | Exceptional $51,891 |
| Estonians | 100.0 /100 | #37 | Exceptional $51,875 |
| Immigrants | Czechoslovakia | 100.0 /100 | #38 | Exceptional $51,770 |
| Cambodians | 100.0 /100 | #39 | Exceptional $51,731 |
| Immigrants | Korea | 100.0 /100 | #40 | Exceptional $51,671 |
| Immigrants | South Africa | 100.0 /100 | #41 | Exceptional $51,465 |
| Immigrants | Turkey | 100.0 /100 | #42 | Exceptional $51,368 |
| Immigrants | Lithuania | 100.0 /100 | #43 | Exceptional $51,361 |
| Immigrants | Europe | 100.0 /100 | #44 | Exceptional $50,950 |
Demographics Similar to Slovaks by Per Capita Income
In terms of per capita income, the demographic groups most similar to Slovaks are South American Indian ($44,206, a difference of 0.050%), Immigrants from Nepal ($44,187, a difference of 0.090%), Uruguayan ($44,318, a difference of 0.20%), South American ($44,114, a difference of 0.26%), and Portuguese ($44,362, a difference of 0.30%).
| Demographics | Rating | Rank | Per Capita Income |
| Koreans | 72.5 /100 | #149 | Good $44,522 |
| Immigrants | Eritrea | 72.1 /100 | #150 | Good $44,509 |
| Norwegians | 71.5 /100 | #151 | Good $44,480 |
| Peruvians | 71.5 /100 | #152 | Good $44,479 |
| Scottish | 70.6 /100 | #153 | Good $44,440 |
| Portuguese | 68.7 /100 | #154 | Good $44,362 |
| Uruguayans | 67.6 /100 | #155 | Good $44,318 |
| Slovaks | 65.4 /100 | #156 | Good $44,229 |
| South American Indians | 64.8 /100 | #157 | Good $44,206 |
| Immigrants | Nepal | 64.3 /100 | #158 | Good $44,187 |
| South Americans | 62.4 /100 | #159 | Good $44,114 |
| Danes | 61.9 /100 | #160 | Good $44,095 |
| Costa Ricans | 61.8 /100 | #161 | Good $44,090 |
| Swiss | 61.4 /100 | #162 | Good $44,076 |
| Immigrants | South America | 61.2 /100 | #163 | Good $44,068 |