Iraqi vs Immigrants from Peru Householder Income Under 25 years
COMPARE
Iraqi
Immigrants from Peru
Householder Income Under 25 years
Householder Income Under 25 years Comparison
Iraqis
Immigrants from Peru
$50,802
HOUSEHOLDER INCOME UNDER 25 YEARS
3.2/ 100
METRIC RATING
238th/ 347
METRIC RANK
$56,384
HOUSEHOLDER INCOME UNDER 25 YEARS
100.0/ 100
METRIC RATING
28th/ 347
METRIC RANK
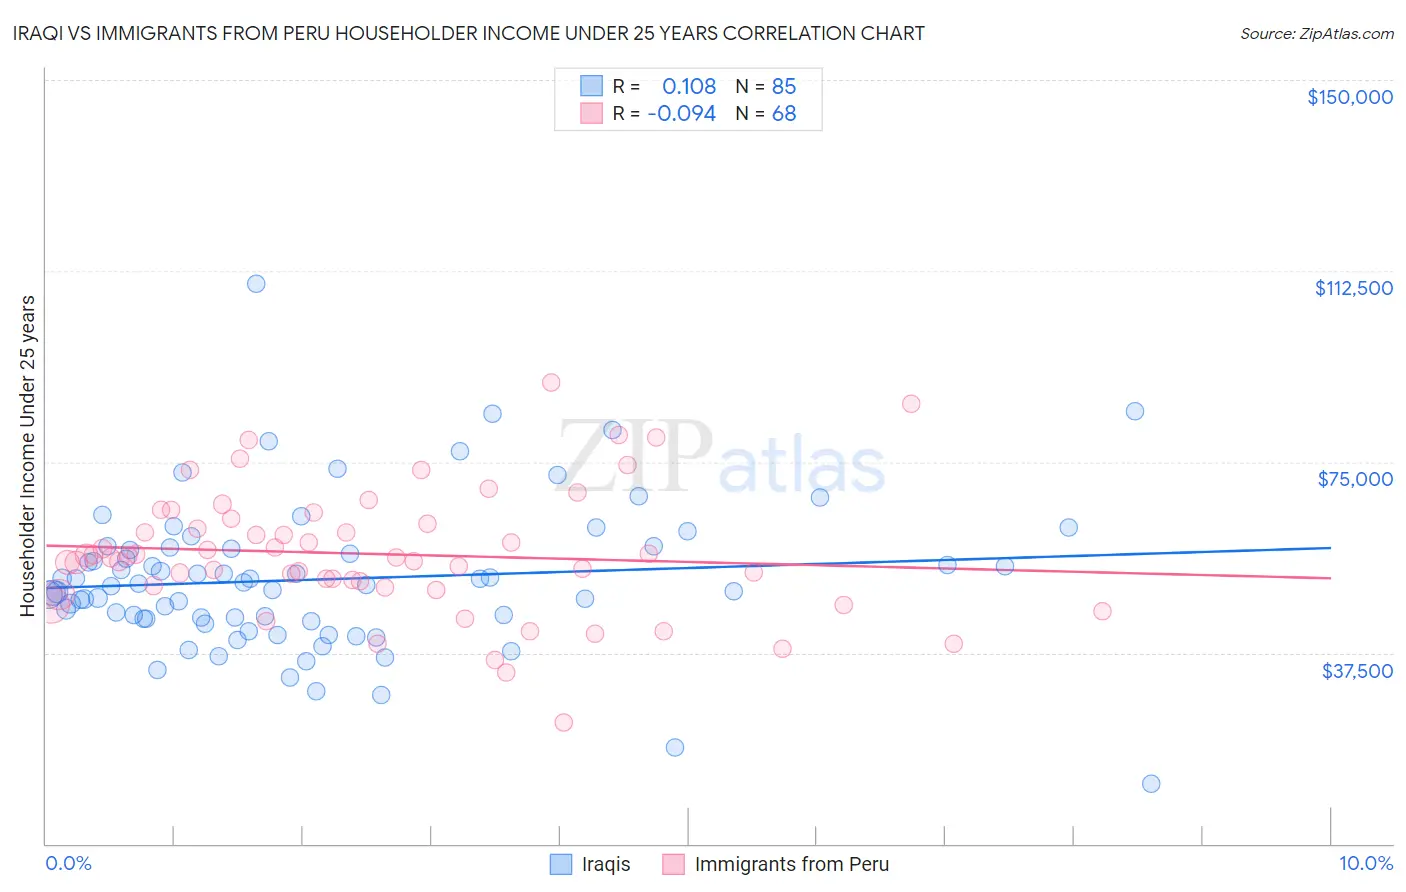
Iraqi vs Immigrants from Peru Householder Income Under 25 years Correlation Chart
The statistical analysis conducted on geographies consisting of 156,411,431 people shows a poor positive correlation between the proportion of Iraqis and household income with householder under the age of 25 in the United States with a correlation coefficient (R) of 0.108 and weighted average of $50,802. Similarly, the statistical analysis conducted on geographies consisting of 281,649,293 people shows a slight negative correlation between the proportion of Immigrants from Peru and household income with householder under the age of 25 in the United States with a correlation coefficient (R) of -0.094 and weighted average of $56,384, a difference of 11.0%.
Householder Income Under 25 years Correlation Summary
| Measurement | Iraqi | Immigrants from Peru |
| Minimum | $11,835 | $23,750 |
| Maximum | $109,885 | $90,496 |
| Range | $98,050 | $66,746 |
| Mean | $51,943 | $56,893 |
| Median | $50,714 | $56,174 |
| Interquartile 25% (IQ1) | $44,189 | $50,499 |
| Interquartile 75% (IQ3) | $58,150 | $63,350 |
| Interquartile Range (IQR) | $13,961 | $12,851 |
| Standard Deviation (Sample) | $14,592 | $12,520 |
| Standard Deviation (Population) | $14,506 | $12,427 |
Similar Demographics by Householder Income Under 25 years
Demographics Similar to Iraqis by Householder Income Under 25 years
In terms of householder income under 25 years, the demographic groups most similar to Iraqis are German ($50,804, a difference of 0.0%), English ($50,805, a difference of 0.010%), Spanish ($50,813, a difference of 0.020%), Kenyan ($50,815, a difference of 0.030%), and Immigrants from Caribbean ($50,757, a difference of 0.090%).
| Demographics | Rating | Rank | Householder Income Under 25 years |
| Ugandans | 4.3 /100 | #231 | Tragic $50,923 |
| Slovenes | 4.0 /100 | #232 | Tragic $50,886 |
| Pennsylvania Germans | 3.7 /100 | #233 | Tragic $50,852 |
| Kenyans | 3.3 /100 | #234 | Tragic $50,815 |
| Spanish | 3.3 /100 | #235 | Tragic $50,813 |
| English | 3.3 /100 | #236 | Tragic $50,805 |
| Germans | 3.3 /100 | #237 | Tragic $50,804 |
| Iraqis | 3.2 /100 | #238 | Tragic $50,802 |
| Immigrants | Caribbean | 2.9 /100 | #239 | Tragic $50,757 |
| Immigrants | Lebanon | 2.7 /100 | #240 | Tragic $50,729 |
| Immigrants | Micronesia | 2.5 /100 | #241 | Tragic $50,691 |
| Cubans | 2.3 /100 | #242 | Tragic $50,655 |
| Immigrants | Thailand | 2.2 /100 | #243 | Tragic $50,645 |
| Marshallese | 2.1 /100 | #244 | Tragic $50,627 |
| Immigrants | Africa | 2.0 /100 | #245 | Tragic $50,609 |
Demographics Similar to Immigrants from Peru by Householder Income Under 25 years
In terms of householder income under 25 years, the demographic groups most similar to Immigrants from Peru are Immigrants from Asia ($56,379, a difference of 0.010%), Immigrants from North Macedonia ($56,503, a difference of 0.21%), Immigrants from Moldova ($56,168, a difference of 0.38%), Vietnamese ($56,127, a difference of 0.46%), and Immigrants from Australia ($56,660, a difference of 0.49%).
| Demographics | Rating | Rank | Householder Income Under 25 years |
| Immigrants | Fiji | 100.0 /100 | #21 | Exceptional $57,074 |
| Asians | 100.0 /100 | #22 | Exceptional $57,003 |
| Tongans | 100.0 /100 | #23 | Exceptional $56,972 |
| Immigrants | Singapore | 100.0 /100 | #24 | Exceptional $56,835 |
| Immigrants | Pakistan | 100.0 /100 | #25 | Exceptional $56,789 |
| Immigrants | Australia | 100.0 /100 | #26 | Exceptional $56,660 |
| Immigrants | North Macedonia | 100.0 /100 | #27 | Exceptional $56,503 |
| Immigrants | Peru | 100.0 /100 | #28 | Exceptional $56,384 |
| Immigrants | Asia | 100.0 /100 | #29 | Exceptional $56,379 |
| Immigrants | Moldova | 100.0 /100 | #30 | Exceptional $56,168 |
| Vietnamese | 100.0 /100 | #31 | Exceptional $56,127 |
| Peruvians | 100.0 /100 | #32 | Exceptional $56,052 |
| Inupiat | 100.0 /100 | #33 | Exceptional $55,935 |
| Immigrants | Japan | 100.0 /100 | #34 | Exceptional $55,932 |
| Tlingit-Haida | 100.0 /100 | #35 | Exceptional $55,914 |