Iraqi vs German Householder Income Under 25 years
COMPARE
Iraqi
German
Householder Income Under 25 years
Householder Income Under 25 years Comparison
Iraqis
Germans
$50,802
HOUSEHOLDER INCOME UNDER 25 YEARS
3.2/ 100
METRIC RATING
238th/ 347
METRIC RANK
$50,804
HOUSEHOLDER INCOME UNDER 25 YEARS
3.3/ 100
METRIC RATING
237th/ 347
METRIC RANK
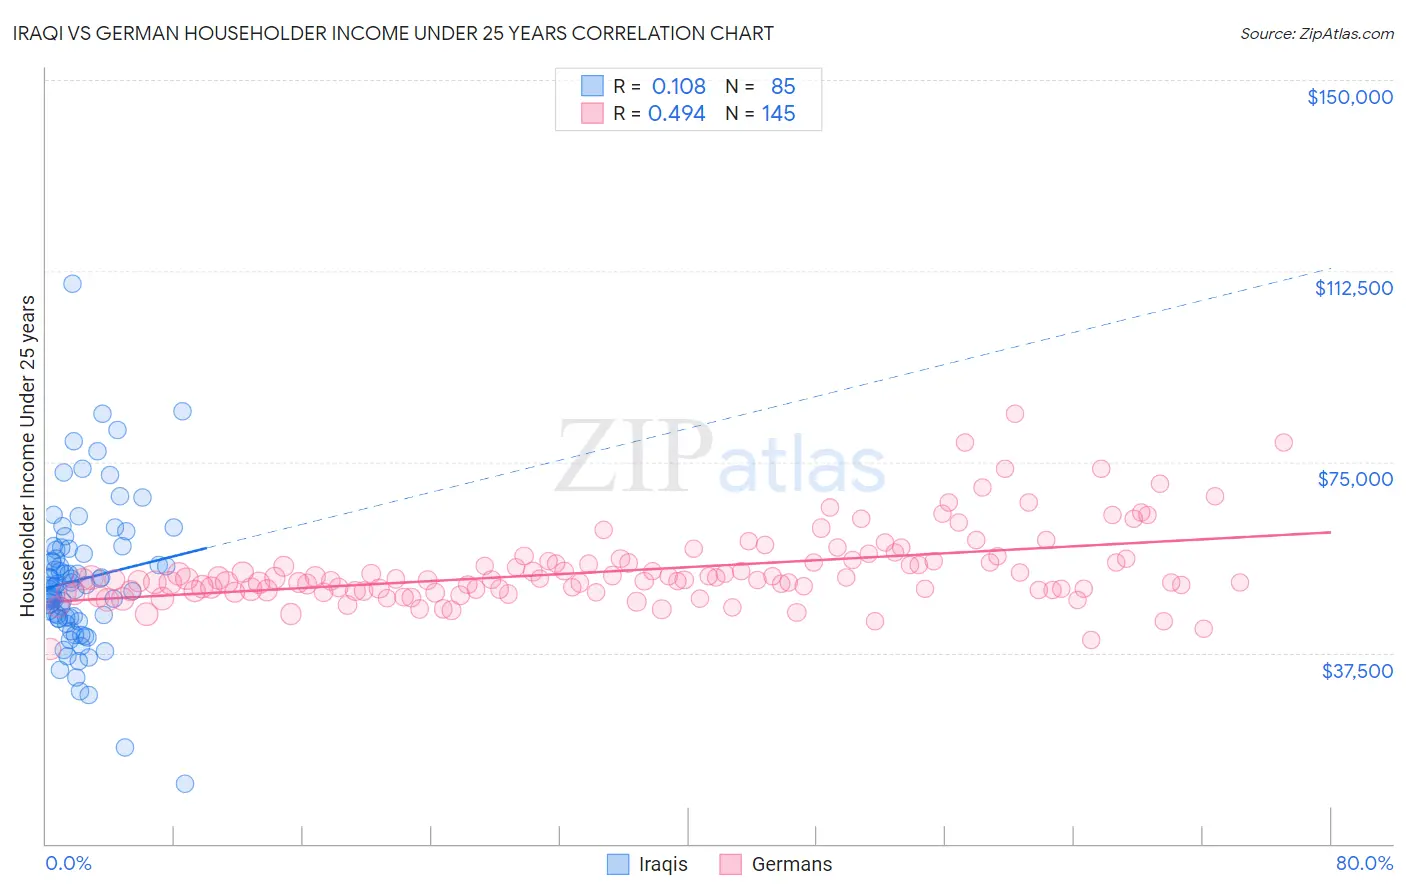
Iraqi vs German Householder Income Under 25 years Correlation Chart
The statistical analysis conducted on geographies consisting of 156,411,431 people shows a poor positive correlation between the proportion of Iraqis and household income with householder under the age of 25 in the United States with a correlation coefficient (R) of 0.108 and weighted average of $50,802. Similarly, the statistical analysis conducted on geographies consisting of 441,162,007 people shows a moderate positive correlation between the proportion of Germans and household income with householder under the age of 25 in the United States with a correlation coefficient (R) of 0.494 and weighted average of $50,804, a difference of 0.0%.
Householder Income Under 25 years Correlation Summary
| Measurement | Iraqi | German |
| Minimum | $11,835 | $38,255 |
| Maximum | $109,885 | $84,455 |
| Range | $98,050 | $46,200 |
| Mean | $51,943 | $53,710 |
| Median | $50,714 | $51,836 |
| Interquartile 25% (IQ1) | $44,189 | $49,689 |
| Interquartile 75% (IQ3) | $58,150 | $55,470 |
| Interquartile Range (IQR) | $13,961 | $5,781 |
| Standard Deviation (Sample) | $14,592 | $7,328 |
| Standard Deviation (Population) | $14,506 | $7,303 |
Demographics Similar to Iraqis and Germans by Householder Income Under 25 years
In terms of householder income under 25 years, the demographic groups most similar to Iraqis are English ($50,805, a difference of 0.010%), Spanish ($50,813, a difference of 0.020%), Kenyan ($50,815, a difference of 0.030%), Immigrants from Caribbean ($50,757, a difference of 0.090%), and Pennsylvania German ($50,852, a difference of 0.10%). Similarly, the demographic groups most similar to Germans are English ($50,805, a difference of 0.0%), Kenyan ($50,815, a difference of 0.020%), Spanish ($50,813, a difference of 0.020%), Pennsylvania German ($50,852, a difference of 0.090%), and Immigrants from Caribbean ($50,757, a difference of 0.090%).
| Demographics | Rating | Rank | Householder Income Under 25 years |
| Immigrants | Central America | 5.4 /100 | #227 | Tragic $51,022 |
| Immigrants | Norway | 5.0 /100 | #228 | Tragic $50,984 |
| Yuman | 4.4 /100 | #229 | Tragic $50,933 |
| Jamaicans | 4.4 /100 | #230 | Tragic $50,929 |
| Ugandans | 4.3 /100 | #231 | Tragic $50,923 |
| Slovenes | 4.0 /100 | #232 | Tragic $50,886 |
| Pennsylvania Germans | 3.7 /100 | #233 | Tragic $50,852 |
| Kenyans | 3.3 /100 | #234 | Tragic $50,815 |
| Spanish | 3.3 /100 | #235 | Tragic $50,813 |
| English | 3.3 /100 | #236 | Tragic $50,805 |
| Germans | 3.3 /100 | #237 | Tragic $50,804 |
| Iraqis | 3.2 /100 | #238 | Tragic $50,802 |
| Immigrants | Caribbean | 2.9 /100 | #239 | Tragic $50,757 |
| Immigrants | Lebanon | 2.7 /100 | #240 | Tragic $50,729 |
| Immigrants | Micronesia | 2.5 /100 | #241 | Tragic $50,691 |
| Cubans | 2.3 /100 | #242 | Tragic $50,655 |
| Immigrants | Thailand | 2.2 /100 | #243 | Tragic $50,645 |
| Marshallese | 2.1 /100 | #244 | Tragic $50,627 |
| Immigrants | Africa | 2.0 /100 | #245 | Tragic $50,609 |
| Welsh | 2.0 /100 | #246 | Tragic $50,597 |
| Immigrants | Bosnia and Herzegovina | 1.8 /100 | #247 | Tragic $50,565 |