Immigrants from Senegal vs Ukrainian Householder Income Ages 25 - 44 years
COMPARE
Immigrants from Senegal
Ukrainian
Householder Income Ages 25 - 44 years
Householder Income Ages 25 - 44 years Comparison
Immigrants from Senegal
Ukrainians
$84,848
HOUSEHOLDER INCOME AGES 25 - 44 YEARS
0.5/ 100
METRIC RATING
259th/ 347
METRIC RANK
$102,451
HOUSEHOLDER INCOME AGES 25 - 44 YEARS
98.8/ 100
METRIC RATING
90th/ 347
METRIC RANK
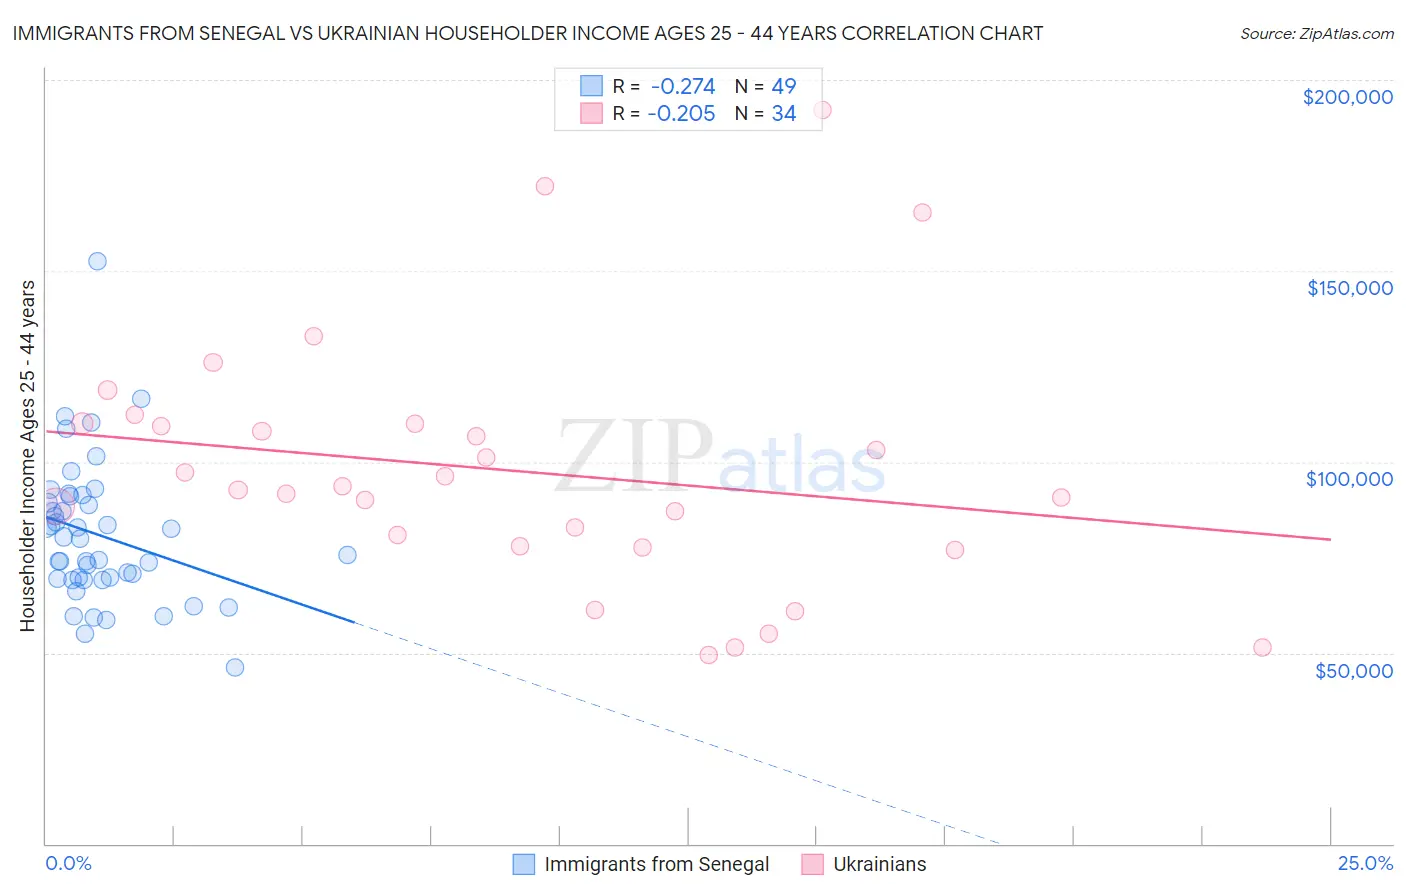
Immigrants from Senegal vs Ukrainian Householder Income Ages 25 - 44 years Correlation Chart
The statistical analysis conducted on geographies consisting of 90,092,145 people shows a weak negative correlation between the proportion of Immigrants from Senegal and household income with householder between the ages 25 and 44 in the United States with a correlation coefficient (R) of -0.274 and weighted average of $84,848. Similarly, the statistical analysis conducted on geographies consisting of 446,911,456 people shows a weak negative correlation between the proportion of Ukrainians and household income with householder between the ages 25 and 44 in the United States with a correlation coefficient (R) of -0.205 and weighted average of $102,451, a difference of 20.7%.
Householder Income Ages 25 - 44 years Correlation Summary
| Measurement | Immigrants from Senegal | Ukrainian |
| Minimum | $46,250 | $49,533 |
| Maximum | $152,414 | $192,200 |
| Range | $106,164 | $142,666 |
| Mean | $80,830 | $97,681 |
| Median | $80,031 | $93,249 |
| Interquartile 25% (IQ1) | $69,279 | $77,819 |
| Interquartile 75% (IQ3) | $90,145 | $109,920 |
| Interquartile Range (IQR) | $20,867 | $32,101 |
| Standard Deviation (Sample) | $18,573 | $32,854 |
| Standard Deviation (Population) | $18,383 | $32,367 |
Similar Demographics by Householder Income Ages 25 - 44 years
Demographics Similar to Immigrants from Senegal by Householder Income Ages 25 - 44 years
In terms of householder income ages 25 - 44 years, the demographic groups most similar to Immigrants from Senegal are American ($84,791, a difference of 0.070%), Immigrants from Nicaragua ($84,914, a difference of 0.080%), Mexican American Indian ($85,066, a difference of 0.26%), Inupiat ($84,619, a difference of 0.27%), and Cree ($84,574, a difference of 0.32%).
| Demographics | Rating | Rank | Householder Income Ages 25 - 44 years |
| Immigrants | Western Africa | 0.7 /100 | #252 | Tragic $85,676 |
| British West Indians | 0.7 /100 | #253 | Tragic $85,565 |
| Immigrants | Laos | 0.7 /100 | #254 | Tragic $85,553 |
| German Russians | 0.6 /100 | #255 | Tragic $85,220 |
| Central Americans | 0.5 /100 | #256 | Tragic $85,144 |
| Mexican American Indians | 0.5 /100 | #257 | Tragic $85,066 |
| Immigrants | Nicaragua | 0.5 /100 | #258 | Tragic $84,914 |
| Immigrants | Senegal | 0.5 /100 | #259 | Tragic $84,848 |
| Americans | 0.4 /100 | #260 | Tragic $84,791 |
| Inupiat | 0.4 /100 | #261 | Tragic $84,619 |
| Cree | 0.4 /100 | #262 | Tragic $84,574 |
| Belizeans | 0.4 /100 | #263 | Tragic $84,534 |
| Osage | 0.4 /100 | #264 | Tragic $84,461 |
| Sudanese | 0.4 /100 | #265 | Tragic $84,401 |
| Immigrants | Cabo Verde | 0.3 /100 | #266 | Tragic $84,304 |
Demographics Similar to Ukrainians by Householder Income Ages 25 - 44 years
In terms of householder income ages 25 - 44 years, the demographic groups most similar to Ukrainians are Croatian ($102,414, a difference of 0.040%), Immigrants from North America ($102,407, a difference of 0.040%), Romanian ($102,544, a difference of 0.090%), Immigrants from Canada ($102,616, a difference of 0.16%), and Immigrants from Hungary ($102,655, a difference of 0.20%).
| Demographics | Rating | Rank | Householder Income Ages 25 - 44 years |
| Argentineans | 99.1 /100 | #83 | Exceptional $103,111 |
| Immigrants | Philippines | 99.0 /100 | #84 | Exceptional $102,910 |
| Immigrants | Ukraine | 98.9 /100 | #85 | Exceptional $102,664 |
| Immigrants | Hungary | 98.9 /100 | #86 | Exceptional $102,655 |
| Immigrants | Western Europe | 98.9 /100 | #87 | Exceptional $102,654 |
| Immigrants | Canada | 98.9 /100 | #88 | Exceptional $102,616 |
| Romanians | 98.8 /100 | #89 | Exceptional $102,544 |
| Ukrainians | 98.8 /100 | #90 | Exceptional $102,451 |
| Croatians | 98.7 /100 | #91 | Exceptional $102,414 |
| Immigrants | North America | 98.7 /100 | #92 | Exceptional $102,407 |
| Immigrants | England | 98.4 /100 | #93 | Exceptional $102,020 |
| Sri Lankans | 98.4 /100 | #94 | Exceptional $101,960 |
| Assyrians/Chaldeans/Syriacs | 98.3 /100 | #95 | Exceptional $101,936 |
| Macedonians | 98.3 /100 | #96 | Exceptional $101,882 |
| Austrians | 98.3 /100 | #97 | Exceptional $101,842 |