Immigrants from Senegal vs Immigrants from Switzerland Householder Income Ages 25 - 44 years
COMPARE
Immigrants from Senegal
Immigrants from Switzerland
Householder Income Ages 25 - 44 years
Householder Income Ages 25 - 44 years Comparison
Immigrants from Senegal
Immigrants from Switzerland
$84,848
HOUSEHOLDER INCOME AGES 25 - 44 YEARS
0.5/ 100
METRIC RATING
259th/ 347
METRIC RANK
$109,185
HOUSEHOLDER INCOME AGES 25 - 44 YEARS
100.0/ 100
METRIC RATING
35th/ 347
METRIC RANK
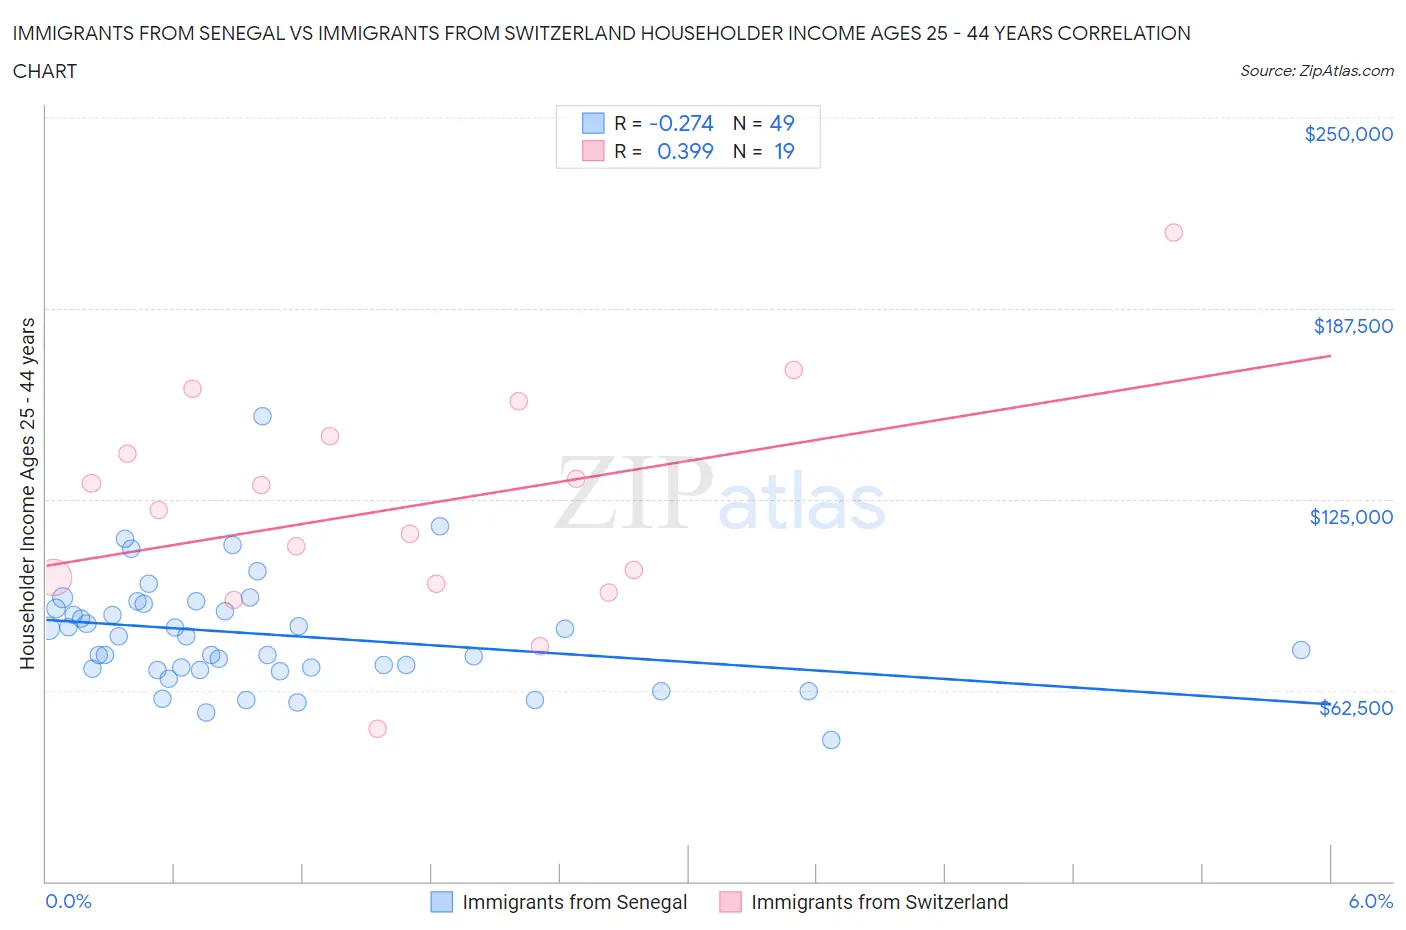
Immigrants from Senegal vs Immigrants from Switzerland Householder Income Ages 25 - 44 years Correlation Chart
The statistical analysis conducted on geographies consisting of 90,092,145 people shows a weak negative correlation between the proportion of Immigrants from Senegal and household income with householder between the ages 25 and 44 in the United States with a correlation coefficient (R) of -0.274 and weighted average of $84,848. Similarly, the statistical analysis conducted on geographies consisting of 147,830,910 people shows a mild positive correlation between the proportion of Immigrants from Switzerland and household income with householder between the ages 25 and 44 in the United States with a correlation coefficient (R) of 0.399 and weighted average of $109,185, a difference of 28.7%.
Householder Income Ages 25 - 44 years Correlation Summary
| Measurement | Immigrants from Senegal | Immigrants from Switzerland |
| Minimum | $46,250 | $50,066 |
| Maximum | $152,414 | $212,344 |
| Range | $106,164 | $162,278 |
| Mean | $80,830 | $122,767 |
| Median | $80,031 | $121,552 |
| Interquartile 25% (IQ1) | $69,279 | $97,500 |
| Interquartile 75% (IQ3) | $90,145 | $145,628 |
| Interquartile Range (IQR) | $20,867 | $48,128 |
| Standard Deviation (Sample) | $18,573 | $37,027 |
| Standard Deviation (Population) | $18,383 | $36,040 |
Similar Demographics by Householder Income Ages 25 - 44 years
Demographics Similar to Immigrants from Senegal by Householder Income Ages 25 - 44 years
In terms of householder income ages 25 - 44 years, the demographic groups most similar to Immigrants from Senegal are American ($84,791, a difference of 0.070%), Immigrants from Nicaragua ($84,914, a difference of 0.080%), Mexican American Indian ($85,066, a difference of 0.26%), Inupiat ($84,619, a difference of 0.27%), and Cree ($84,574, a difference of 0.32%).
| Demographics | Rating | Rank | Householder Income Ages 25 - 44 years |
| Immigrants | Western Africa | 0.7 /100 | #252 | Tragic $85,676 |
| British West Indians | 0.7 /100 | #253 | Tragic $85,565 |
| Immigrants | Laos | 0.7 /100 | #254 | Tragic $85,553 |
| German Russians | 0.6 /100 | #255 | Tragic $85,220 |
| Central Americans | 0.5 /100 | #256 | Tragic $85,144 |
| Mexican American Indians | 0.5 /100 | #257 | Tragic $85,066 |
| Immigrants | Nicaragua | 0.5 /100 | #258 | Tragic $84,914 |
| Immigrants | Senegal | 0.5 /100 | #259 | Tragic $84,848 |
| Americans | 0.4 /100 | #260 | Tragic $84,791 |
| Inupiat | 0.4 /100 | #261 | Tragic $84,619 |
| Cree | 0.4 /100 | #262 | Tragic $84,574 |
| Belizeans | 0.4 /100 | #263 | Tragic $84,534 |
| Osage | 0.4 /100 | #264 | Tragic $84,461 |
| Sudanese | 0.4 /100 | #265 | Tragic $84,401 |
| Immigrants | Cabo Verde | 0.3 /100 | #266 | Tragic $84,304 |
Demographics Similar to Immigrants from Switzerland by Householder Income Ages 25 - 44 years
In terms of householder income ages 25 - 44 years, the demographic groups most similar to Immigrants from Switzerland are Bolivian ($109,372, a difference of 0.17%), Latvian ($108,926, a difference of 0.24%), Bhutanese ($109,520, a difference of 0.31%), Immigrants from Russia ($108,751, a difference of 0.40%), and Immigrants from Sri Lanka ($109,741, a difference of 0.51%).
| Demographics | Rating | Rank | Householder Income Ages 25 - 44 years |
| Immigrants | Denmark | 100.0 /100 | #28 | Exceptional $110,363 |
| Turks | 100.0 /100 | #29 | Exceptional $110,318 |
| Immigrants | Greece | 100.0 /100 | #30 | Exceptional $110,103 |
| Maltese | 100.0 /100 | #31 | Exceptional $110,064 |
| Immigrants | Sri Lanka | 100.0 /100 | #32 | Exceptional $109,741 |
| Bhutanese | 100.0 /100 | #33 | Exceptional $109,520 |
| Bolivians | 100.0 /100 | #34 | Exceptional $109,372 |
| Immigrants | Switzerland | 100.0 /100 | #35 | Exceptional $109,185 |
| Latvians | 100.0 /100 | #36 | Exceptional $108,926 |
| Immigrants | Russia | 100.0 /100 | #37 | Exceptional $108,751 |
| Soviet Union | 100.0 /100 | #38 | Exceptional $108,457 |
| Immigrants | France | 99.9 /100 | #39 | Exceptional $108,257 |
| Immigrants | Lithuania | 99.9 /100 | #40 | Exceptional $108,149 |
| Immigrants | Bolivia | 99.9 /100 | #41 | Exceptional $108,128 |
| Australians | 99.9 /100 | #42 | Exceptional $107,912 |