Immigrants from Pakistan vs Immigrants from Uruguay Householder Income Under 25 years
COMPARE
Immigrants from Pakistan
Immigrants from Uruguay
Householder Income Under 25 years
Householder Income Under 25 years Comparison
Immigrants from Pakistan
Immigrants from Uruguay
$56,789
HOUSEHOLDER INCOME UNDER 25 YEARS
100.0/ 100
METRIC RATING
25th/ 347
METRIC RANK
$52,302
HOUSEHOLDER INCOME UNDER 25 YEARS
56.8/ 100
METRIC RATING
171st/ 347
METRIC RANK
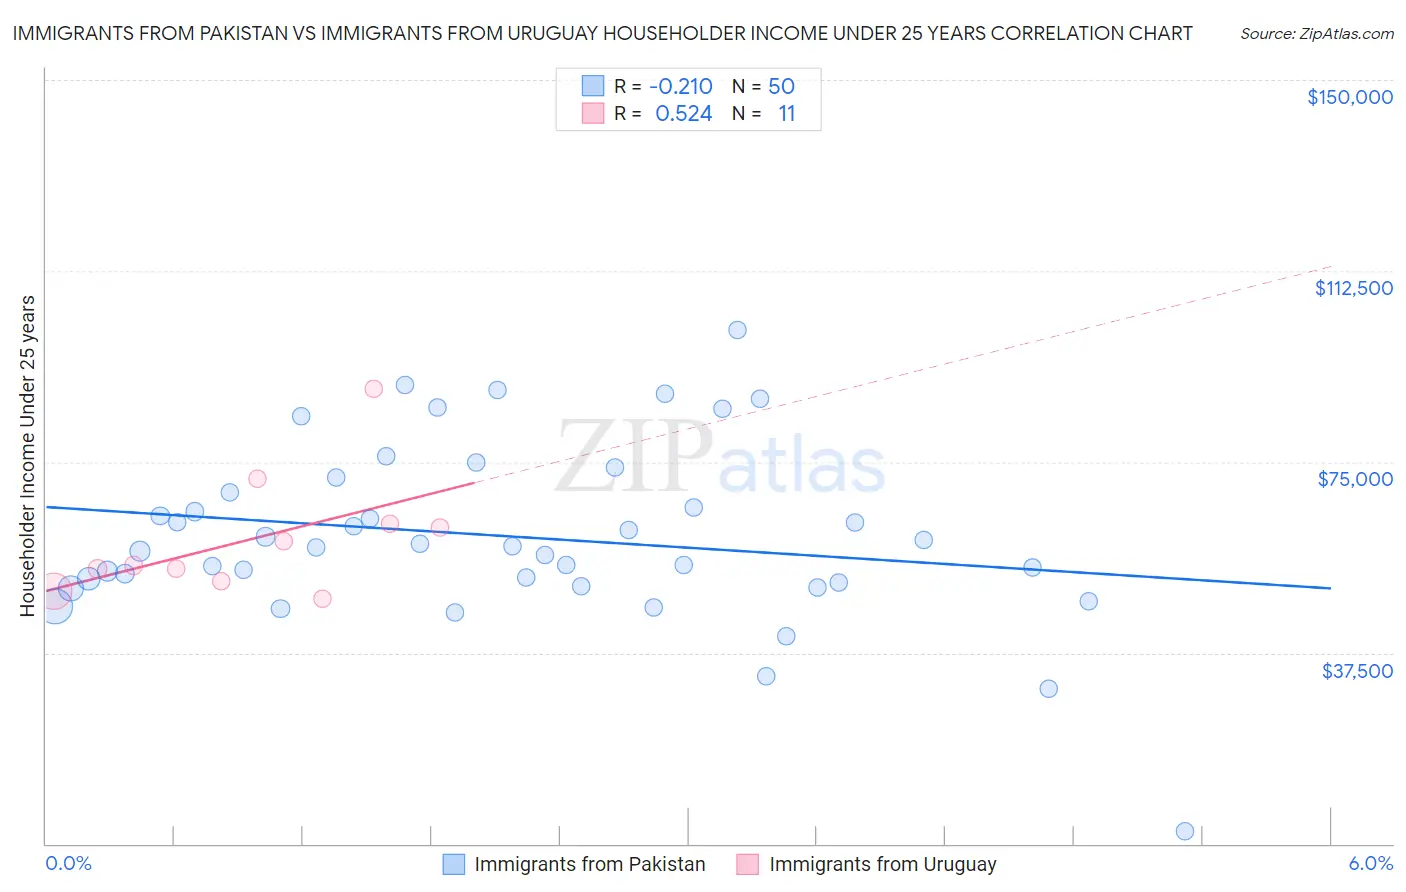
Immigrants from Pakistan vs Immigrants from Uruguay Householder Income Under 25 years Correlation Chart
The statistical analysis conducted on geographies consisting of 246,156,602 people shows a weak negative correlation between the proportion of Immigrants from Pakistan and household income with householder under the age of 25 in the United States with a correlation coefficient (R) of -0.210 and weighted average of $56,789. Similarly, the statistical analysis conducted on geographies consisting of 120,970,355 people shows a substantial positive correlation between the proportion of Immigrants from Uruguay and household income with householder under the age of 25 in the United States with a correlation coefficient (R) of 0.524 and weighted average of $52,302, a difference of 8.6%.
Householder Income Under 25 years Correlation Summary
| Measurement | Immigrants from Pakistan | Immigrants from Uruguay |
| Minimum | $2,499 | $48,209 |
| Maximum | $100,795 | $89,343 |
| Range | $98,296 | $41,134 |
| Mean | $60,406 | $59,760 |
| Median | $58,281 | $54,632 |
| Interquartile 25% (IQ1) | $51,362 | $51,644 |
| Interquartile 75% (IQ3) | $69,066 | $62,813 |
| Interquartile Range (IQR) | $17,704 | $11,169 |
| Standard Deviation (Sample) | $17,398 | $11,950 |
| Standard Deviation (Population) | $17,223 | $11,394 |
Similar Demographics by Householder Income Under 25 years
Demographics Similar to Immigrants from Pakistan by Householder Income Under 25 years
In terms of householder income under 25 years, the demographic groups most similar to Immigrants from Pakistan are Immigrants from Singapore ($56,835, a difference of 0.080%), Immigrants from Australia ($56,660, a difference of 0.23%), Tongan ($56,972, a difference of 0.32%), Asian ($57,003, a difference of 0.38%), and Immigrants from Ireland ($57,075, a difference of 0.50%).
| Demographics | Rating | Rank | Householder Income Under 25 years |
| Immigrants | Eastern Asia | 100.0 /100 | #18 | Exceptional $57,123 |
| Bhutanese | 100.0 /100 | #19 | Exceptional $57,078 |
| Immigrants | Ireland | 100.0 /100 | #20 | Exceptional $57,075 |
| Immigrants | Fiji | 100.0 /100 | #21 | Exceptional $57,074 |
| Asians | 100.0 /100 | #22 | Exceptional $57,003 |
| Tongans | 100.0 /100 | #23 | Exceptional $56,972 |
| Immigrants | Singapore | 100.0 /100 | #24 | Exceptional $56,835 |
| Immigrants | Pakistan | 100.0 /100 | #25 | Exceptional $56,789 |
| Immigrants | Australia | 100.0 /100 | #26 | Exceptional $56,660 |
| Immigrants | North Macedonia | 100.0 /100 | #27 | Exceptional $56,503 |
| Immigrants | Peru | 100.0 /100 | #28 | Exceptional $56,384 |
| Immigrants | Asia | 100.0 /100 | #29 | Exceptional $56,379 |
| Immigrants | Moldova | 100.0 /100 | #30 | Exceptional $56,168 |
| Vietnamese | 100.0 /100 | #31 | Exceptional $56,127 |
| Peruvians | 100.0 /100 | #32 | Exceptional $56,052 |
Demographics Similar to Immigrants from Uruguay by Householder Income Under 25 years
In terms of householder income under 25 years, the demographic groups most similar to Immigrants from Uruguay are Israeli ($52,335, a difference of 0.060%), Canadian ($52,336, a difference of 0.070%), Japanese ($52,365, a difference of 0.12%), Immigrants from Uganda ($52,374, a difference of 0.14%), and Cypriot ($52,209, a difference of 0.18%).
| Demographics | Rating | Rank | Householder Income Under 25 years |
| Immigrants | Trinidad and Tobago | 64.7 /100 | #164 | Good $52,437 |
| Poles | 63.0 /100 | #165 | Good $52,407 |
| Immigrants | Austria | 62.6 /100 | #166 | Good $52,400 |
| Immigrants | Uganda | 61.1 /100 | #167 | Good $52,374 |
| Japanese | 60.5 /100 | #168 | Good $52,365 |
| Canadians | 58.8 /100 | #169 | Average $52,336 |
| Israelis | 58.8 /100 | #170 | Average $52,335 |
| Immigrants | Uruguay | 56.8 /100 | #171 | Average $52,302 |
| Cypriots | 51.2 /100 | #172 | Average $52,209 |
| Barbadians | 50.8 /100 | #173 | Average $52,202 |
| Immigrants | Western Asia | 50.0 /100 | #174 | Average $52,190 |
| Immigrants | Zimbabwe | 33.8 /100 | #175 | Fair $51,914 |
| Austrians | 32.9 /100 | #176 | Fair $51,898 |
| British West Indians | 30.0 /100 | #177 | Fair $51,844 |
| Finns | 29.2 /100 | #178 | Fair $51,827 |