Immigrants from Pakistan vs Immigrants from Iran Householder Income Under 25 years
COMPARE
Immigrants from Pakistan
Immigrants from Iran
Householder Income Under 25 years
Householder Income Under 25 years Comparison
Immigrants from Pakistan
Immigrants from Iran
$56,789
HOUSEHOLDER INCOME UNDER 25 YEARS
100.0/ 100
METRIC RATING
25th/ 347
METRIC RANK
$55,880
HOUSEHOLDER INCOME UNDER 25 YEARS
100.0/ 100
METRIC RATING
38th/ 347
METRIC RANK
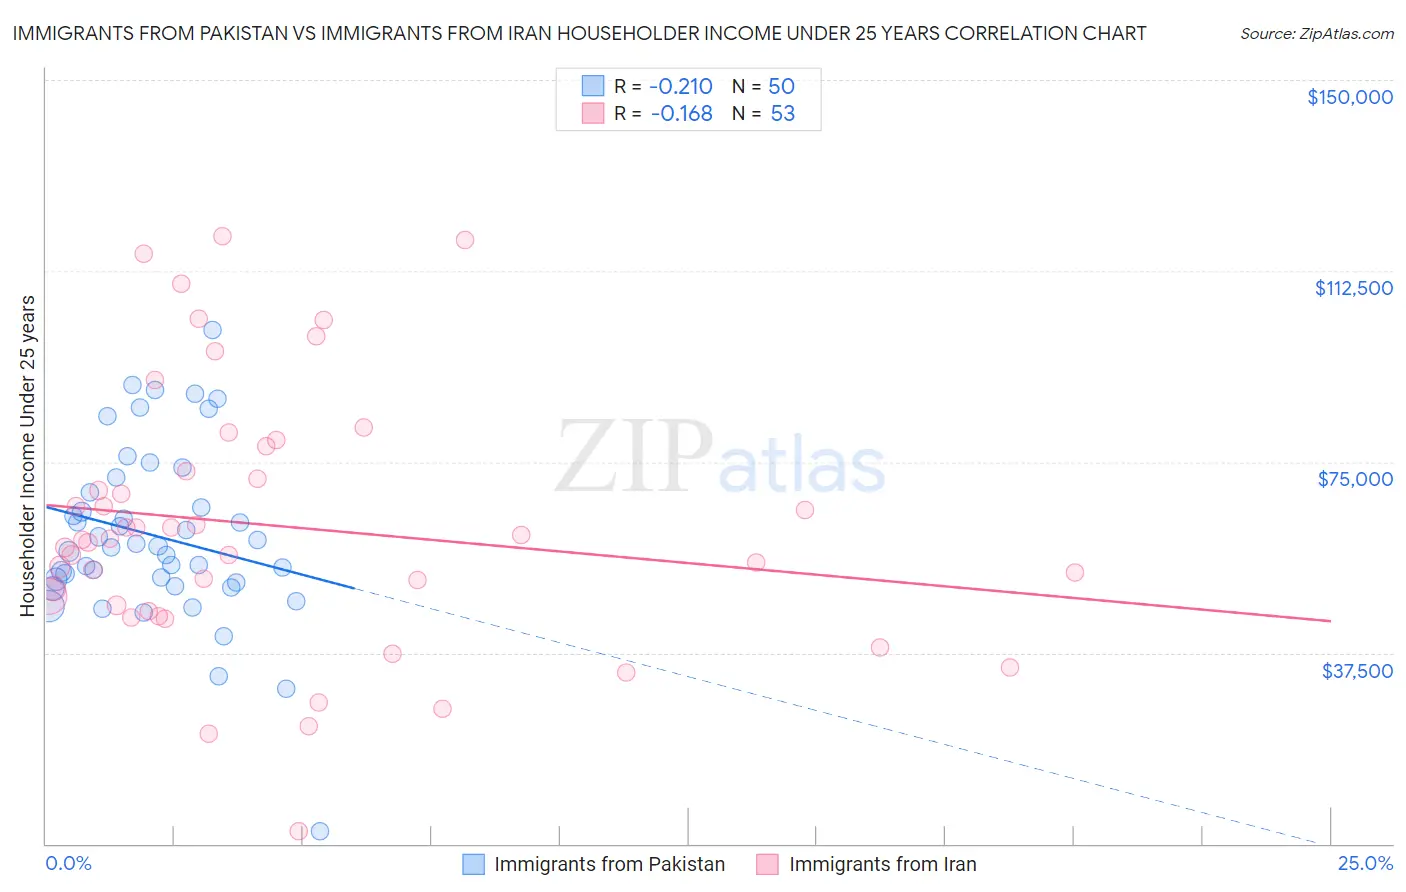
Immigrants from Pakistan vs Immigrants from Iran Householder Income Under 25 years Correlation Chart
The statistical analysis conducted on geographies consisting of 246,156,602 people shows a weak negative correlation between the proportion of Immigrants from Pakistan and household income with householder under the age of 25 in the United States with a correlation coefficient (R) of -0.210 and weighted average of $56,789. Similarly, the statistical analysis conducted on geographies consisting of 243,590,616 people shows a poor negative correlation between the proportion of Immigrants from Iran and household income with householder under the age of 25 in the United States with a correlation coefficient (R) of -0.168 and weighted average of $55,880, a difference of 1.6%.
Householder Income Under 25 years Correlation Summary
| Measurement | Immigrants from Pakistan | Immigrants from Iran |
| Minimum | $2,499 | $2,499 |
| Maximum | $100,795 | $119,306 |
| Range | $98,296 | $116,807 |
| Mean | $60,406 | $62,431 |
| Median | $58,281 | $59,731 |
| Interquartile 25% (IQ1) | $51,362 | $46,300 |
| Interquartile 75% (IQ3) | $69,066 | $75,617 |
| Interquartile Range (IQR) | $17,704 | $29,317 |
| Standard Deviation (Sample) | $17,398 | $25,668 |
| Standard Deviation (Population) | $17,223 | $25,425 |
Demographics Similar to Immigrants from Pakistan and Immigrants from Iran by Householder Income Under 25 years
In terms of householder income under 25 years, the demographic groups most similar to Immigrants from Pakistan are Immigrants from Singapore ($56,835, a difference of 0.080%), Immigrants from Australia ($56,660, a difference of 0.23%), Tongan ($56,972, a difference of 0.32%), Asian ($57,003, a difference of 0.38%), and Immigrants from Fiji ($57,074, a difference of 0.50%). Similarly, the demographic groups most similar to Immigrants from Iran are Immigrants from Russia ($55,891, a difference of 0.020%), Tlingit-Haida ($55,914, a difference of 0.060%), Immigrants from Israel ($55,913, a difference of 0.060%), Immigrants from Japan ($55,932, a difference of 0.090%), and Inupiat ($55,935, a difference of 0.10%).
| Demographics | Rating | Rank | Householder Income Under 25 years |
| Immigrants | Fiji | 100.0 /100 | #21 | Exceptional $57,074 |
| Asians | 100.0 /100 | #22 | Exceptional $57,003 |
| Tongans | 100.0 /100 | #23 | Exceptional $56,972 |
| Immigrants | Singapore | 100.0 /100 | #24 | Exceptional $56,835 |
| Immigrants | Pakistan | 100.0 /100 | #25 | Exceptional $56,789 |
| Immigrants | Australia | 100.0 /100 | #26 | Exceptional $56,660 |
| Immigrants | North Macedonia | 100.0 /100 | #27 | Exceptional $56,503 |
| Immigrants | Peru | 100.0 /100 | #28 | Exceptional $56,384 |
| Immigrants | Asia | 100.0 /100 | #29 | Exceptional $56,379 |
| Immigrants | Moldova | 100.0 /100 | #30 | Exceptional $56,168 |
| Vietnamese | 100.0 /100 | #31 | Exceptional $56,127 |
| Peruvians | 100.0 /100 | #32 | Exceptional $56,052 |
| Inupiat | 100.0 /100 | #33 | Exceptional $55,935 |
| Immigrants | Japan | 100.0 /100 | #34 | Exceptional $55,932 |
| Tlingit-Haida | 100.0 /100 | #35 | Exceptional $55,914 |
| Immigrants | Israel | 100.0 /100 | #36 | Exceptional $55,913 |
| Immigrants | Russia | 100.0 /100 | #37 | Exceptional $55,891 |
| Immigrants | Iran | 100.0 /100 | #38 | Exceptional $55,880 |
| Immigrants | Belarus | 100.0 /100 | #39 | Exceptional $55,743 |
| Immigrants | Greece | 100.0 /100 | #40 | Exceptional $55,727 |
| Immigrants | Guyana | 100.0 /100 | #41 | Exceptional $55,726 |