Immigrants from North America vs Ukrainian Median Male Earnings
COMPARE
Immigrants from North America
Ukrainian
Median Male Earnings
Median Male Earnings Comparison
Immigrants from North America
Ukrainians
$60,265
MEDIAN MALE EARNINGS
99.7/ 100
METRIC RATING
73rd/ 347
METRIC RANK
$59,728
MEDIAN MALE EARNINGS
99.4/ 100
METRIC RATING
81st/ 347
METRIC RANK
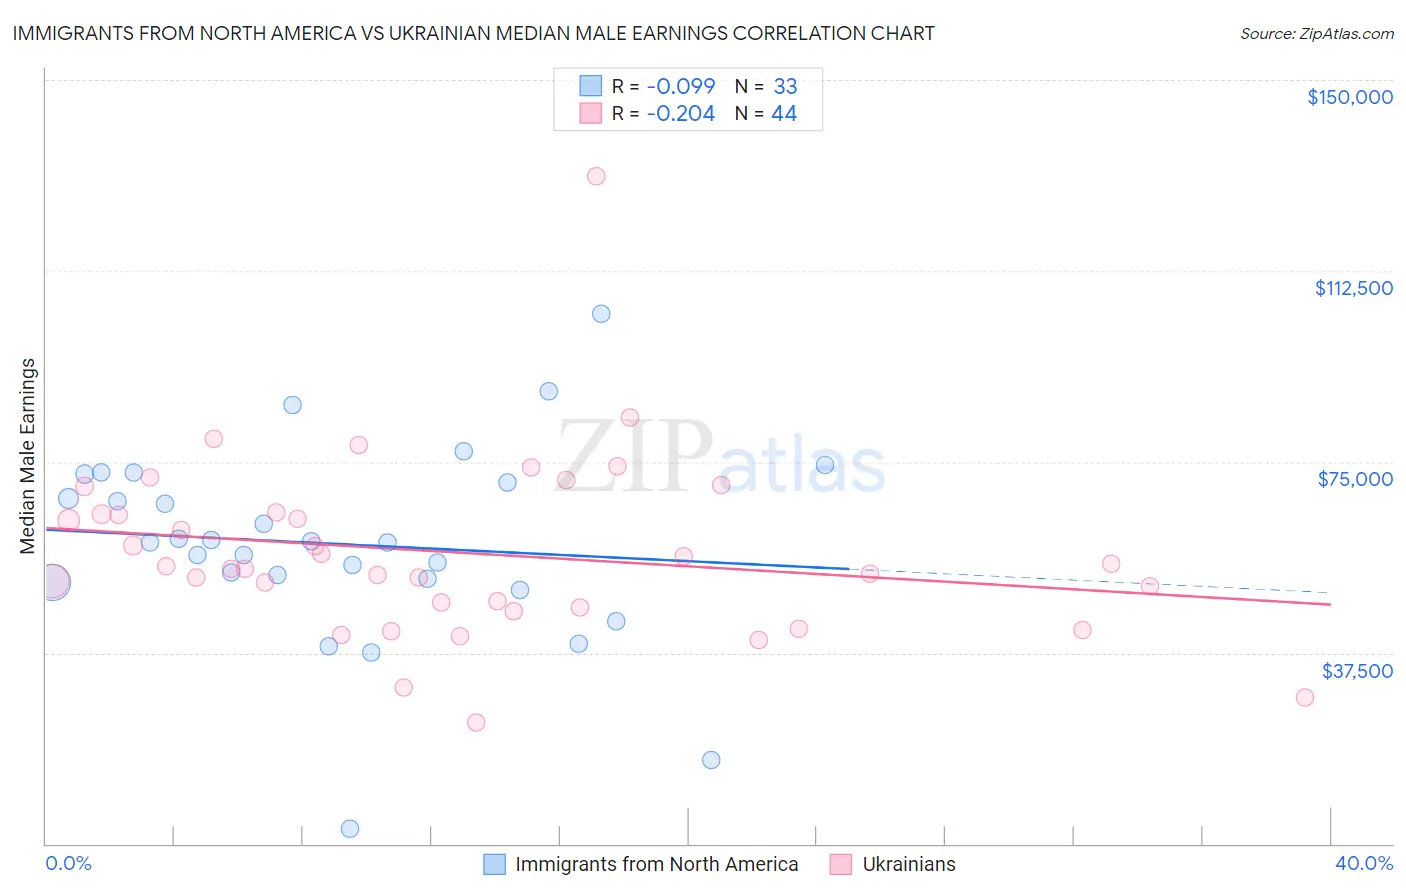
Immigrants from North America vs Ukrainian Median Male Earnings Correlation Chart
The statistical analysis conducted on geographies consisting of 462,182,608 people shows a slight negative correlation between the proportion of Immigrants from North America and median male earnings in the United States with a correlation coefficient (R) of -0.099 and weighted average of $60,265. Similarly, the statistical analysis conducted on geographies consisting of 448,432,137 people shows a weak negative correlation between the proportion of Ukrainians and median male earnings in the United States with a correlation coefficient (R) of -0.204 and weighted average of $59,728, a difference of 0.90%.
Median Male Earnings Correlation Summary
| Measurement | Immigrants from North America | Ukrainian |
| Minimum | $2,875 | $23,696 |
| Maximum | $104,091 | $131,091 |
| Range | $101,216 | $107,394 |
| Mean | $58,890 | $57,214 |
| Median | $59,220 | $54,259 |
| Interquartile 25% (IQ1) | $51,688 | $46,850 |
| Interquartile 75% (IQ3) | $71,762 | $64,861 |
| Interquartile Range (IQR) | $20,074 | $18,011 |
| Standard Deviation (Sample) | $19,290 | $17,751 |
| Standard Deviation (Population) | $18,995 | $17,548 |
Demographics Similar to Immigrants from North America and Ukrainians by Median Male Earnings
In terms of median male earnings, the demographic groups most similar to Immigrants from North America are Immigrants from Western Europe ($60,334, a difference of 0.12%), Mongolian ($60,350, a difference of 0.14%), Immigrants from Bulgaria ($60,358, a difference of 0.16%), Immigrants from Canada ($60,388, a difference of 0.20%), and Argentinean ($60,117, a difference of 0.25%). Similarly, the demographic groups most similar to Ukrainians are Croatian ($59,715, a difference of 0.020%), Immigrants from Italy ($59,691, a difference of 0.060%), Immigrants from Hungary ($59,806, a difference of 0.13%), Immigrants from Ukraine ($59,820, a difference of 0.16%), and Afghan ($59,554, a difference of 0.29%).
| Demographics | Rating | Rank | Median Male Earnings |
| Immigrants | Spain | 99.8 /100 | #67 | Exceptional $60,750 |
| Immigrants | Serbia | 99.7 /100 | #68 | Exceptional $60,600 |
| Immigrants | Canada | 99.7 /100 | #69 | Exceptional $60,388 |
| Immigrants | Bulgaria | 99.7 /100 | #70 | Exceptional $60,358 |
| Mongolians | 99.7 /100 | #71 | Exceptional $60,350 |
| Immigrants | Western Europe | 99.7 /100 | #72 | Exceptional $60,334 |
| Immigrants | North America | 99.7 /100 | #73 | Exceptional $60,265 |
| Argentineans | 99.6 /100 | #74 | Exceptional $60,117 |
| Immigrants | Bolivia | 99.6 /100 | #75 | Exceptional $60,088 |
| Romanians | 99.6 /100 | #76 | Exceptional $60,063 |
| Paraguayans | 99.5 /100 | #77 | Exceptional $59,975 |
| Immigrants | Egypt | 99.5 /100 | #78 | Exceptional $59,925 |
| Immigrants | Ukraine | 99.5 /100 | #79 | Exceptional $59,820 |
| Immigrants | Hungary | 99.5 /100 | #80 | Exceptional $59,806 |
| Ukrainians | 99.4 /100 | #81 | Exceptional $59,728 |
| Croatians | 99.4 /100 | #82 | Exceptional $59,715 |
| Immigrants | Italy | 99.4 /100 | #83 | Exceptional $59,691 |
| Afghans | 99.3 /100 | #84 | Exceptional $59,554 |
| Italians | 99.3 /100 | #85 | Exceptional $59,551 |
| Immigrants | England | 99.3 /100 | #86 | Exceptional $59,527 |
| Macedonians | 99.3 /100 | #87 | Exceptional $59,522 |