Immigrants from El Salvador vs Ukrainian Median Male Earnings
COMPARE
Immigrants from El Salvador
Ukrainian
Median Male Earnings
Median Male Earnings Comparison
Immigrants from El Salvador
Ukrainians
$47,973
MEDIAN MALE EARNINGS
0.2/ 100
METRIC RATING
287th/ 347
METRIC RANK
$59,728
MEDIAN MALE EARNINGS
99.4/ 100
METRIC RATING
81st/ 347
METRIC RANK
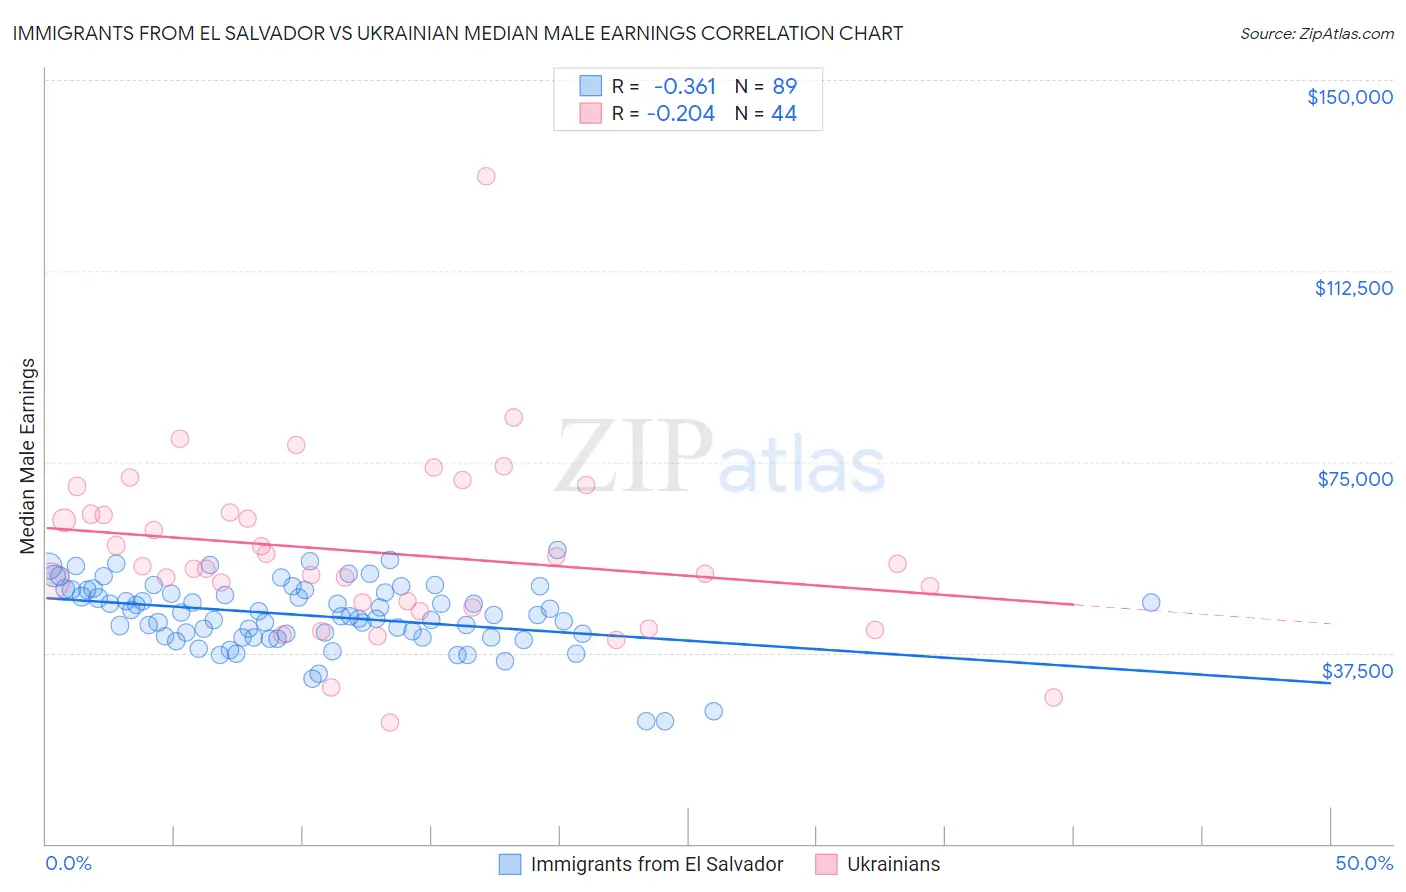
Immigrants from El Salvador vs Ukrainian Median Male Earnings Correlation Chart
The statistical analysis conducted on geographies consisting of 357,755,814 people shows a mild negative correlation between the proportion of Immigrants from El Salvador and median male earnings in the United States with a correlation coefficient (R) of -0.361 and weighted average of $47,973. Similarly, the statistical analysis conducted on geographies consisting of 448,432,137 people shows a weak negative correlation between the proportion of Ukrainians and median male earnings in the United States with a correlation coefficient (R) of -0.204 and weighted average of $59,728, a difference of 24.5%.
Median Male Earnings Correlation Summary
| Measurement | Immigrants from El Salvador | Ukrainian |
| Minimum | $24,025 | $23,696 |
| Maximum | $57,715 | $131,091 |
| Range | $33,690 | $107,394 |
| Mean | $44,787 | $57,214 |
| Median | $44,909 | $54,259 |
| Interquartile 25% (IQ1) | $40,644 | $46,850 |
| Interquartile 75% (IQ3) | $49,826 | $64,861 |
| Interquartile Range (IQR) | $9,182 | $18,011 |
| Standard Deviation (Sample) | $6,677 | $17,751 |
| Standard Deviation (Population) | $6,639 | $17,548 |
Similar Demographics by Median Male Earnings
Demographics Similar to Immigrants from El Salvador by Median Male Earnings
In terms of median male earnings, the demographic groups most similar to Immigrants from El Salvador are African ($47,994, a difference of 0.040%), Paiute ($47,991, a difference of 0.040%), Mexican American Indian ($47,990, a difference of 0.040%), Shoshone ($47,930, a difference of 0.090%), and Immigrants from Jamaica ($48,040, a difference of 0.14%).
| Demographics | Rating | Rank | Median Male Earnings |
| Comanche | 0.2 /100 | #280 | Tragic $48,202 |
| Marshallese | 0.2 /100 | #281 | Tragic $48,137 |
| Central Americans | 0.2 /100 | #282 | Tragic $48,093 |
| Immigrants | Jamaica | 0.2 /100 | #283 | Tragic $48,040 |
| Africans | 0.2 /100 | #284 | Tragic $47,994 |
| Paiute | 0.2 /100 | #285 | Tragic $47,991 |
| Mexican American Indians | 0.2 /100 | #286 | Tragic $47,990 |
| Immigrants | El Salvador | 0.2 /100 | #287 | Tragic $47,973 |
| Shoshone | 0.2 /100 | #288 | Tragic $47,930 |
| Chickasaw | 0.1 /100 | #289 | Tragic $47,832 |
| Immigrants | Belize | 0.1 /100 | #290 | Tragic $47,809 |
| Choctaw | 0.1 /100 | #291 | Tragic $47,729 |
| Immigrants | Dominica | 0.1 /100 | #292 | Tragic $47,651 |
| Indonesians | 0.1 /100 | #293 | Tragic $47,503 |
| Immigrants | Nicaragua | 0.1 /100 | #294 | Tragic $47,482 |
Demographics Similar to Ukrainians by Median Male Earnings
In terms of median male earnings, the demographic groups most similar to Ukrainians are Croatian ($59,715, a difference of 0.020%), Immigrants from Italy ($59,691, a difference of 0.060%), Immigrants from Hungary ($59,806, a difference of 0.13%), Immigrants from Ukraine ($59,820, a difference of 0.16%), and Afghan ($59,554, a difference of 0.29%).
| Demographics | Rating | Rank | Median Male Earnings |
| Argentineans | 99.6 /100 | #74 | Exceptional $60,117 |
| Immigrants | Bolivia | 99.6 /100 | #75 | Exceptional $60,088 |
| Romanians | 99.6 /100 | #76 | Exceptional $60,063 |
| Paraguayans | 99.5 /100 | #77 | Exceptional $59,975 |
| Immigrants | Egypt | 99.5 /100 | #78 | Exceptional $59,925 |
| Immigrants | Ukraine | 99.5 /100 | #79 | Exceptional $59,820 |
| Immigrants | Hungary | 99.5 /100 | #80 | Exceptional $59,806 |
| Ukrainians | 99.4 /100 | #81 | Exceptional $59,728 |
| Croatians | 99.4 /100 | #82 | Exceptional $59,715 |
| Immigrants | Italy | 99.4 /100 | #83 | Exceptional $59,691 |
| Afghans | 99.3 /100 | #84 | Exceptional $59,554 |
| Italians | 99.3 /100 | #85 | Exceptional $59,551 |
| Immigrants | England | 99.3 /100 | #86 | Exceptional $59,527 |
| Macedonians | 99.3 /100 | #87 | Exceptional $59,522 |
| Immigrants | Argentina | 99.3 /100 | #88 | Exceptional $59,491 |