Immigrants from Mexico vs French Canadian Householder Income Over 65 years
COMPARE
Immigrants from Mexico
French Canadian
Householder Income Over 65 years
Householder Income Over 65 years Comparison
Immigrants from Mexico
French Canadians
$52,801
HOUSEHOLDER INCOME OVER 65 YEARS
0.0/ 100
METRIC RATING
308th/ 347
METRIC RANK
$57,975
HOUSEHOLDER INCOME OVER 65 YEARS
4.2/ 100
METRIC RATING
226th/ 347
METRIC RANK
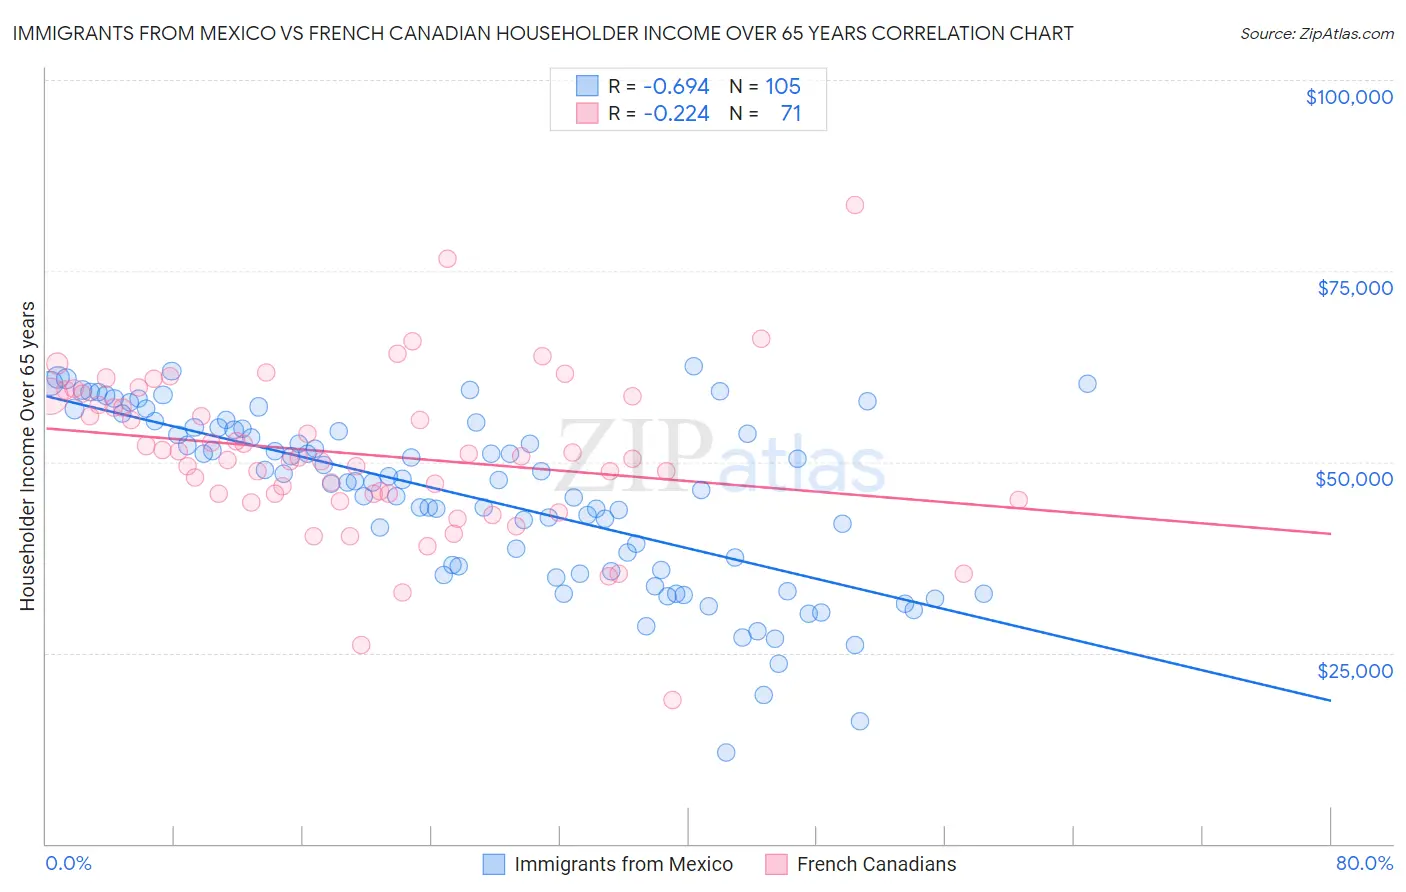
Immigrants from Mexico vs French Canadian Householder Income Over 65 years Correlation Chart
The statistical analysis conducted on geographies consisting of 510,126,392 people shows a significant negative correlation between the proportion of Immigrants from Mexico and household income with householder over the age of 65 in the United States with a correlation coefficient (R) of -0.694 and weighted average of $52,801. Similarly, the statistical analysis conducted on geographies consisting of 499,919,017 people shows a weak negative correlation between the proportion of French Canadians and household income with householder over the age of 65 in the United States with a correlation coefficient (R) of -0.224 and weighted average of $57,975, a difference of 9.8%.
Householder Income Over 65 years Correlation Summary
| Measurement | Immigrants from Mexico | French Canadian |
| Minimum | $11,979 | $18,750 |
| Maximum | $62,508 | $83,631 |
| Range | $50,529 | $64,881 |
| Mean | $45,341 | $51,013 |
| Median | $47,467 | $50,515 |
| Interquartile 25% (IQ1) | $35,778 | $45,820 |
| Interquartile 75% (IQ3) | $54,433 | $58,631 |
| Interquartile Range (IQR) | $18,654 | $12,810 |
| Standard Deviation (Sample) | $11,387 | $10,428 |
| Standard Deviation (Population) | $11,333 | $10,355 |
Similar Demographics by Householder Income Over 65 years
Demographics Similar to Immigrants from Mexico by Householder Income Over 65 years
In terms of householder income over 65 years, the demographic groups most similar to Immigrants from Mexico are Hispanic or Latino ($52,832, a difference of 0.060%), Pennsylvania German ($52,888, a difference of 0.17%), Pueblo ($52,930, a difference of 0.24%), Ute ($52,949, a difference of 0.28%), and Honduran ($52,634, a difference of 0.32%).
| Demographics | Rating | Rank | Householder Income Over 65 years |
| Yuman | 0.0 /100 | #301 | Tragic $53,110 |
| Spanish American Indians | 0.0 /100 | #302 | Tragic $53,077 |
| Choctaw | 0.0 /100 | #303 | Tragic $53,060 |
| Ute | 0.0 /100 | #304 | Tragic $52,949 |
| Pueblo | 0.0 /100 | #305 | Tragic $52,930 |
| Pennsylvania Germans | 0.0 /100 | #306 | Tragic $52,888 |
| Hispanics or Latinos | 0.0 /100 | #307 | Tragic $52,832 |
| Immigrants | Mexico | 0.0 /100 | #308 | Tragic $52,801 |
| Hondurans | 0.0 /100 | #309 | Tragic $52,634 |
| Sioux | 0.0 /100 | #310 | Tragic $52,509 |
| Seminole | 0.0 /100 | #311 | Tragic $52,373 |
| Immigrants | Azores | 0.0 /100 | #312 | Tragic $52,121 |
| Immigrants | Nicaragua | 0.0 /100 | #313 | Tragic $52,085 |
| Natives/Alaskans | 0.0 /100 | #314 | Tragic $52,081 |
| U.S. Virgin Islanders | 0.0 /100 | #315 | Tragic $52,072 |
Demographics Similar to French Canadians by Householder Income Over 65 years
In terms of householder income over 65 years, the demographic groups most similar to French Canadians are Venezuelan ($58,026, a difference of 0.090%), Japanese ($57,919, a difference of 0.10%), Immigrants from Albania ($57,828, a difference of 0.25%), Bermudan ($58,171, a difference of 0.34%), and Tsimshian ($58,202, a difference of 0.39%).
| Demographics | Rating | Rank | Householder Income Over 65 years |
| Malaysians | 5.5 /100 | #219 | Tragic $58,244 |
| Yugoslavians | 5.5 /100 | #220 | Tragic $58,243 |
| Immigrants | El Salvador | 5.4 /100 | #221 | Tragic $58,226 |
| Delaware | 5.3 /100 | #222 | Tragic $58,214 |
| Tsimshian | 5.2 /100 | #223 | Tragic $58,202 |
| Bermudans | 5.1 /100 | #224 | Tragic $58,171 |
| Venezuelans | 4.4 /100 | #225 | Tragic $58,026 |
| French Canadians | 4.2 /100 | #226 | Tragic $57,975 |
| Japanese | 3.9 /100 | #227 | Tragic $57,919 |
| Immigrants | Albania | 3.6 /100 | #228 | Tragic $57,828 |
| Immigrants | Colombia | 3.0 /100 | #229 | Tragic $57,658 |
| Immigrants | Cambodia | 2.8 /100 | #230 | Tragic $57,580 |
| Immigrants | Nonimmigrants | 2.4 /100 | #231 | Tragic $57,426 |
| Immigrants | Venezuela | 2.3 /100 | #232 | Tragic $57,371 |
| Immigrants | Western Africa | 1.7 /100 | #233 | Tragic $57,119 |