Immigrants from Liberia vs Immigrants from Cuba Householder Income Under 25 years
COMPARE
Immigrants from Liberia
Immigrants from Cuba
Householder Income Under 25 years
Householder Income Under 25 years Comparison
Immigrants from Liberia
Immigrants from Cuba
$47,981
HOUSEHOLDER INCOME UNDER 25 YEARS
0.0/ 100
METRIC RATING
302nd/ 347
METRIC RANK
$50,374
HOUSEHOLDER INCOME UNDER 25 YEARS
1.2/ 100
METRIC RATING
256th/ 347
METRIC RANK
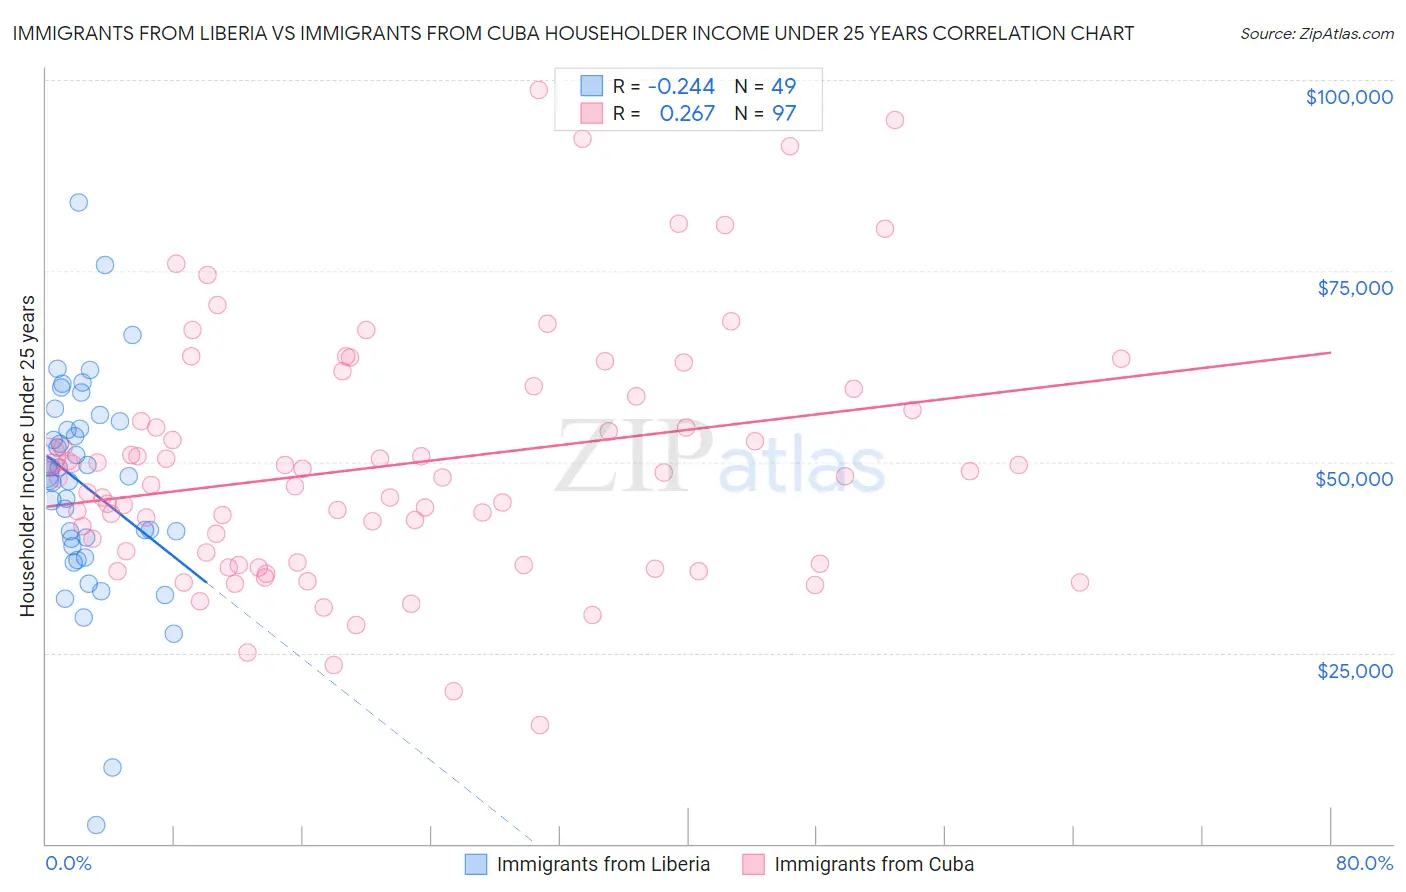
Immigrants from Liberia vs Immigrants from Cuba Householder Income Under 25 years Correlation Chart
The statistical analysis conducted on geographies consisting of 125,997,994 people shows a weak negative correlation between the proportion of Immigrants from Liberia and household income with householder under the age of 25 in the United States with a correlation coefficient (R) of -0.244 and weighted average of $47,981. Similarly, the statistical analysis conducted on geographies consisting of 277,974,730 people shows a weak positive correlation between the proportion of Immigrants from Cuba and household income with householder under the age of 25 in the United States with a correlation coefficient (R) of 0.267 and weighted average of $50,374, a difference of 5.0%.
Householder Income Under 25 years Correlation Summary
| Measurement | Immigrants from Liberia | Immigrants from Cuba |
| Minimum | $2,499 | $15,559 |
| Maximum | $83,909 | $98,696 |
| Range | $81,410 | $83,137 |
| Mean | $46,823 | $49,616 |
| Median | $48,090 | $47,927 |
| Interquartile 25% (IQ1) | $39,377 | $36,760 |
| Interquartile 75% (IQ3) | $54,819 | $57,708 |
| Interquartile Range (IQR) | $15,443 | $20,948 |
| Standard Deviation (Sample) | $14,198 | $16,198 |
| Standard Deviation (Population) | $14,053 | $16,114 |
Similar Demographics by Householder Income Under 25 years
Demographics Similar to Immigrants from Liberia by Householder Income Under 25 years
In terms of householder income under 25 years, the demographic groups most similar to Immigrants from Liberia are Immigrants from Middle Africa ($47,916, a difference of 0.14%), Menominee ($47,907, a difference of 0.15%), Cherokee ($47,848, a difference of 0.28%), Immigrants from Kuwait ($48,126, a difference of 0.30%), and Immigrants from Somalia ($48,135, a difference of 0.32%).
| Demographics | Rating | Rank | Householder Income Under 25 years |
| Central American Indians | 0.0 /100 | #295 | Tragic $48,643 |
| Blackfeet | 0.0 /100 | #296 | Tragic $48,603 |
| Cree | 0.0 /100 | #297 | Tragic $48,514 |
| Yaqui | 0.0 /100 | #298 | Tragic $48,300 |
| Immigrants | Honduras | 0.0 /100 | #299 | Tragic $48,267 |
| Immigrants | Somalia | 0.0 /100 | #300 | Tragic $48,135 |
| Immigrants | Kuwait | 0.0 /100 | #301 | Tragic $48,126 |
| Immigrants | Liberia | 0.0 /100 | #302 | Tragic $47,981 |
| Immigrants | Middle Africa | 0.0 /100 | #303 | Tragic $47,916 |
| Menominee | 0.0 /100 | #304 | Tragic $47,907 |
| Cherokee | 0.0 /100 | #305 | Tragic $47,848 |
| Natives/Alaskans | 0.0 /100 | #306 | Tragic $47,704 |
| Bangladeshis | 0.0 /100 | #307 | Tragic $47,589 |
| Comanche | 0.0 /100 | #308 | Tragic $47,518 |
| U.S. Virgin Islanders | 0.0 /100 | #309 | Tragic $47,448 |
Demographics Similar to Immigrants from Cuba by Householder Income Under 25 years
In terms of householder income under 25 years, the demographic groups most similar to Immigrants from Cuba are Aleut ($50,377, a difference of 0.0%), Luxembourger ($50,379, a difference of 0.010%), Lebanese ($50,355, a difference of 0.040%), Immigrants from Haiti ($50,398, a difference of 0.050%), and White/Caucasian ($50,336, a difference of 0.080%).
| Demographics | Rating | Rank | Householder Income Under 25 years |
| Scottish | 1.8 /100 | #249 | Tragic $50,554 |
| Immigrants | Cabo Verde | 1.7 /100 | #250 | Tragic $50,520 |
| Celtics | 1.4 /100 | #251 | Tragic $50,447 |
| Immigrants | Mexico | 1.3 /100 | #252 | Tragic $50,422 |
| Immigrants | Haiti | 1.2 /100 | #253 | Tragic $50,398 |
| Luxembourgers | 1.2 /100 | #254 | Tragic $50,379 |
| Aleuts | 1.2 /100 | #255 | Tragic $50,377 |
| Immigrants | Cuba | 1.2 /100 | #256 | Tragic $50,374 |
| Lebanese | 1.1 /100 | #257 | Tragic $50,355 |
| Whites/Caucasians | 1.1 /100 | #258 | Tragic $50,336 |
| Immigrants | Dominica | 1.0 /100 | #259 | Tragic $50,301 |
| Hispanics or Latinos | 0.9 /100 | #260 | Tragic $50,279 |
| Hungarians | 0.9 /100 | #261 | Tragic $50,247 |
| Haitians | 0.8 /100 | #262 | Tragic $50,231 |
| Immigrants | Dominican Republic | 0.8 /100 | #263 | Tragic $50,204 |