Immigrants from Kenya vs Tongan Median Female Earnings
COMPARE
Immigrants from Kenya
Tongan
Median Female Earnings
Median Female Earnings Comparison
Immigrants from Kenya
Tongans
$39,535
MEDIAN FEMALE EARNINGS
41.6/ 100
METRIC RATING
180th/ 347
METRIC RANK
$38,288
MEDIAN FEMALE EARNINGS
5.1/ 100
METRIC RATING
233rd/ 347
METRIC RANK
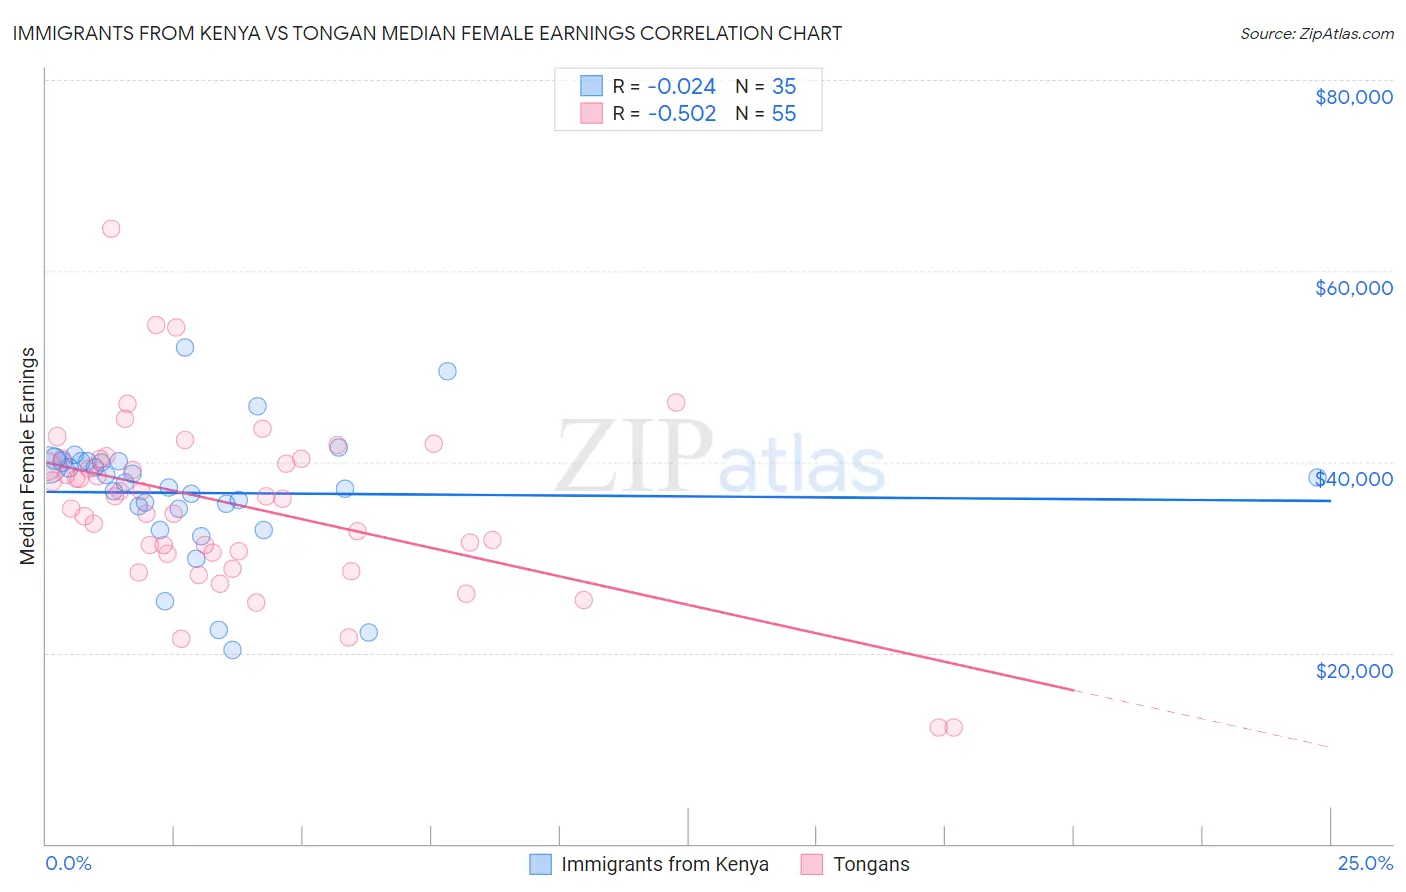
Immigrants from Kenya vs Tongan Median Female Earnings Correlation Chart
The statistical analysis conducted on geographies consisting of 218,064,981 people shows no correlation between the proportion of Immigrants from Kenya and median female earnings in the United States with a correlation coefficient (R) of -0.024 and weighted average of $39,535. Similarly, the statistical analysis conducted on geographies consisting of 102,899,109 people shows a substantial negative correlation between the proportion of Tongans and median female earnings in the United States with a correlation coefficient (R) of -0.502 and weighted average of $38,288, a difference of 3.3%.
Median Female Earnings Correlation Summary
| Measurement | Immigrants from Kenya | Tongan |
| Minimum | $20,281 | $12,128 |
| Maximum | $51,989 | $64,435 |
| Range | $31,708 | $52,307 |
| Mean | $36,741 | $35,533 |
| Median | $37,816 | $36,346 |
| Interquartile 25% (IQ1) | $35,077 | $30,514 |
| Interquartile 75% (IQ3) | $40,014 | $40,343 |
| Interquartile Range (IQR) | $4,937 | $9,829 |
| Standard Deviation (Sample) | $6,740 | $9,124 |
| Standard Deviation (Population) | $6,643 | $9,040 |
Similar Demographics by Median Female Earnings
Demographics Similar to Immigrants from Kenya by Median Female Earnings
In terms of median female earnings, the demographic groups most similar to Immigrants from Kenya are Tsimshian ($39,530, a difference of 0.010%), Tlingit-Haida ($39,513, a difference of 0.060%), Hungarian ($39,510, a difference of 0.060%), Immigrants from Germany ($39,603, a difference of 0.17%), and Slavic ($39,613, a difference of 0.20%).
| Demographics | Rating | Rank | Median Female Earnings |
| Canadians | 51.4 /100 | #173 | Average $39,724 |
| South Americans | 50.0 /100 | #174 | Average $39,698 |
| Immigrants | South America | 47.2 /100 | #175 | Average $39,643 |
| Nigerians | 47.0 /100 | #176 | Average $39,641 |
| Costa Ricans | 46.1 /100 | #177 | Average $39,622 |
| Slavs | 45.6 /100 | #178 | Average $39,613 |
| Immigrants | Germany | 45.1 /100 | #179 | Average $39,603 |
| Immigrants | Kenya | 41.6 /100 | #180 | Average $39,535 |
| Tsimshian | 41.4 /100 | #181 | Average $39,530 |
| Tlingit-Haida | 40.5 /100 | #182 | Average $39,513 |
| Hungarians | 40.3 /100 | #183 | Average $39,510 |
| Europeans | 37.7 /100 | #184 | Fair $39,457 |
| Immigrants | West Indies | 36.9 /100 | #185 | Fair $39,441 |
| Colombians | 36.9 /100 | #186 | Fair $39,439 |
| Swedes | 36.0 /100 | #187 | Fair $39,421 |
Demographics Similar to Tongans by Median Female Earnings
In terms of median female earnings, the demographic groups most similar to Tongans are Celtic ($38,283, a difference of 0.010%), Scandinavian ($38,306, a difference of 0.050%), Somali ($38,333, a difference of 0.12%), Basque ($38,352, a difference of 0.17%), and Sudanese ($38,215, a difference of 0.19%).
| Demographics | Rating | Rank | Median Female Earnings |
| French Canadians | 6.8 /100 | #226 | Tragic $38,436 |
| Scottish | 6.3 /100 | #227 | Tragic $38,397 |
| Sub-Saharan Africans | 6.2 /100 | #228 | Tragic $38,391 |
| Belgians | 6.1 /100 | #229 | Tragic $38,382 |
| Basques | 5.7 /100 | #230 | Tragic $38,352 |
| Somalis | 5.5 /100 | #231 | Tragic $38,333 |
| Scandinavians | 5.2 /100 | #232 | Tragic $38,306 |
| Tongans | 5.1 /100 | #233 | Tragic $38,288 |
| Celtics | 5.0 /100 | #234 | Tragic $38,283 |
| Sudanese | 4.4 /100 | #235 | Tragic $38,215 |
| Liberians | 4.4 /100 | #236 | Tragic $38,215 |
| Immigrants | Cabo Verde | 4.3 /100 | #237 | Tragic $38,208 |
| Alaska Natives | 4.3 /100 | #238 | Tragic $38,202 |
| English | 4.2 /100 | #239 | Tragic $38,196 |
| Finns | 4.0 /100 | #240 | Tragic $38,173 |